Hudson River Undergraduate Math Conference - 2018
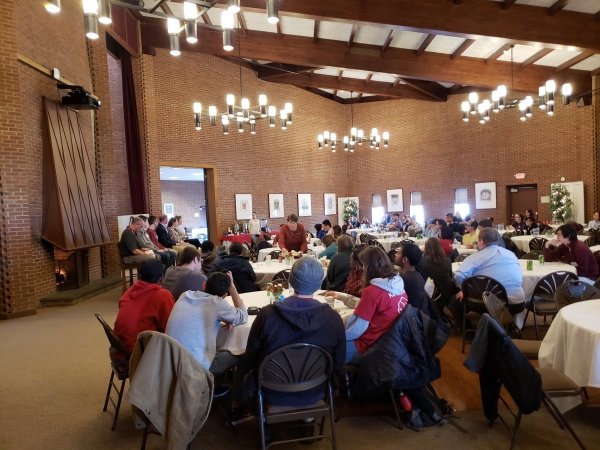
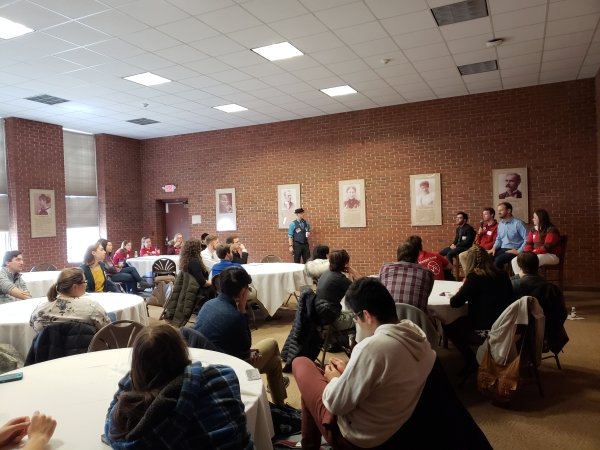
HRUMC was at St. Lawrence University on April 7, 2018. Keynote Speaker: Karen Saxe, Macalester College. Funded in part by a grant from the National Science Foundation, DMS 1807502. Nine SLU student presented abstracts, see below:

Yue Yang
“More About Time Series: When the Variance is Not Constant”
In time series, there is a powerful model called ARMA(autoregressive moving average) model which is used to analyze data set that is considered to have constant variance. My senior year project is about analyzing data set that does not have constant variance, so in this talk, I will briefly introduce GRACH(generalized autoregressive conditional heteroskedasticity) model and talk about how I used different packages in R to get a deeper understanding of GARCH model.
Xiaobing Wang
“Comparing Randomization Methods for Difference in Means Using Simulations in R”
In this presentation, I will explain five randomization methods for difference in means: Reallocate Groups, Shift Groups, Combine Groups, t-test and Pooled t-test. Then, I will use r-generated datasets to evaluate those five methods by Kolmogorov-Smirnov test and two visualization techniques: density plot and diff plot
Michael Williams
“Chaos T.
Chaos Theory, which was discovered throughout the late 19th century and deeply studied through the mid-20th century, is a mathematical insight that concentrates on dynamical systems that are highly sensitive to initial conditions as well as minuscule changes in inputs. When applying Chaos Theory to economic
markets, it is easy to see the relation of an economic market to a chaotic dynamic system, as they are each highly volatile and non-linear. In this application, a question lies in whether these markets show random chaos or deterministic chaos, or similarly, how much of the market outcomes are random and how much
could be predicted. In attempting to uncover this question, I will show why traditional market predicting tools are often inaccurate without the idea of chaos as well as the benefits in predicting markets when taking into account four-dimensional models as opposed to two or three. I will also explore long-standing economic and social ideas such as the "butterfly effect" and the "invisible hand" and explain how Chaos Theory is at the root of these ideas.
Ashley Norris, Allie Roberts and Madison Goodwine
“Statistical Data College and Analysis of SLU Lacrosse Data”
For this project we are collecting and analyzing the St. Lawrence University Varsity Men’s Lacrosse games for the 2018 season. Lacrosse analytics is a field with little prior research, so we started our project by prioritizing statistics to track with the Coaches. While statistics for the game are tracked, we are doing a more in-depth analysis by focusing on their offensive efficiency and face-offs. For offensive efficiency, we analyze both individual player involvement and also how the team is doing overall. We track statistics such as: positive/negative turnovers for individual players, the number of quality scoring opportunities within a possession, the number of quality shots in a possession and the outcomes for each offensive possession. Our goal is to find trends in the team’s offensive efficiency and provide analyses for the Coaches to make data-driven decisions.
Shyanne White
“Exploring Facebook Through R: A Statistical Computing And Graphics Environment”
In a world where social media is the main way people stay in touch and stay updated with news, it is important to be able to understand and analyze what comes out of these websites. Facebook is one of many social apps used globally and contains many fascinating aspects that can be analyzed on a statistical level. Packages coming from social media websites have been created, which can be analyzed within the statistical program R. Recently the R-Facebook package has been created, which calls for exploration. With this project, not only will the limitations of what can be accessed with this new package be tested, but from the data accessed, an app that allows students who do not know much about the program R will be made so that the data from the package can be accessed and analyzed easily, as well as interactive classroom assignments to round their understanding of statistics.
Yuxi Zhang
“Chaotic Cryptography Digital Image Encryption Based on Chaotic Maps”
Chaos theory is the study of the behavior of dynamic systems that are, among other things, highly sensitive to initial conditions and parameters. Since Edward Lorenz coined the term butterfly effect in the 1960s to describe chaotic behavior in weather prediction, chaos theory has been applied to a variety of fields including weather and climate, biology, economics, and physics. In the past few decades, people also have been exploring its potential applications in cryptography. This talk will focus on digital chaotic systems, introducing some of the newer techniques in applying chaotic maps to encrypt digital images. If time permits we will also talk about the security analysis of these cryptographic techniques
Nevaan Perera
“Using Sentiment Analysis to Detect Bullying and Toxicity on Social Media”
The current project involves analyzing facebook posts and comments to detect cyber bullies and level of toxicity on social media. Sentiment analysis methods could be used to attach a score to each post or comment, and see how toxic it is. Sentiment analysis refers to the task of natural language processing to determine whether a piece of text contains some subjective information and what subjective information it expresses; for example whether a comment or attitude is positive, negative or neutral. We hope to gather a large dataset of posts and comments, where each post will have it’s most frequent words, positivity score, negativity score etc. By using the data we could answer many questions such as “are there particular topics that make comments toxic?” or “What are the most frequently used toxic words on the internet?”. Results from the current project could help in preventing cyber bullies roaming the world wide web.
Delaney Spink
"The Beauty in Chaos: Fractals and Art"
Fractals were given their name in 1975 by Benoit Mandelbrot, but since long before that time fractals have captured the minds and imaginations of artists and mathematicians alike for both their beauty and their complexity. Fractals, on the surface, can easily be recognized as art on their own - but there is much more to them than what meets the eye. We will be exploring the intersection between art and fractals and some of the interesting properties of fractal art.
Anna Izzo
“Sentiment Analysis in R”
In a world that is ever-evolving, people are no longer complaining about companies through their 1-800 numbers. Rather, if a company's products or services are disliked, consumers visit social media platforms, such as Facebook, twitter, Instagram, etc., and post their complaints in plain sight. Because of this, companies must show diligence in listening and responding to those who reach out in this manner.
Over the summer, Anna Izzo worked to understand and improve the efficiency and accuracy of determining sentiment through automation, instead of human power. From back end to front, she will share how she created a model in R to score over 15000 tweets in less than 20 seconds- now that's fast!

