Festival of Science, Scholarship & Creativity 2022
Festival of Science, Scholarship & Creativity Friday, April 29, 2022
Kimberly Merchant, Faculty Ed Harcourt, Computer Science
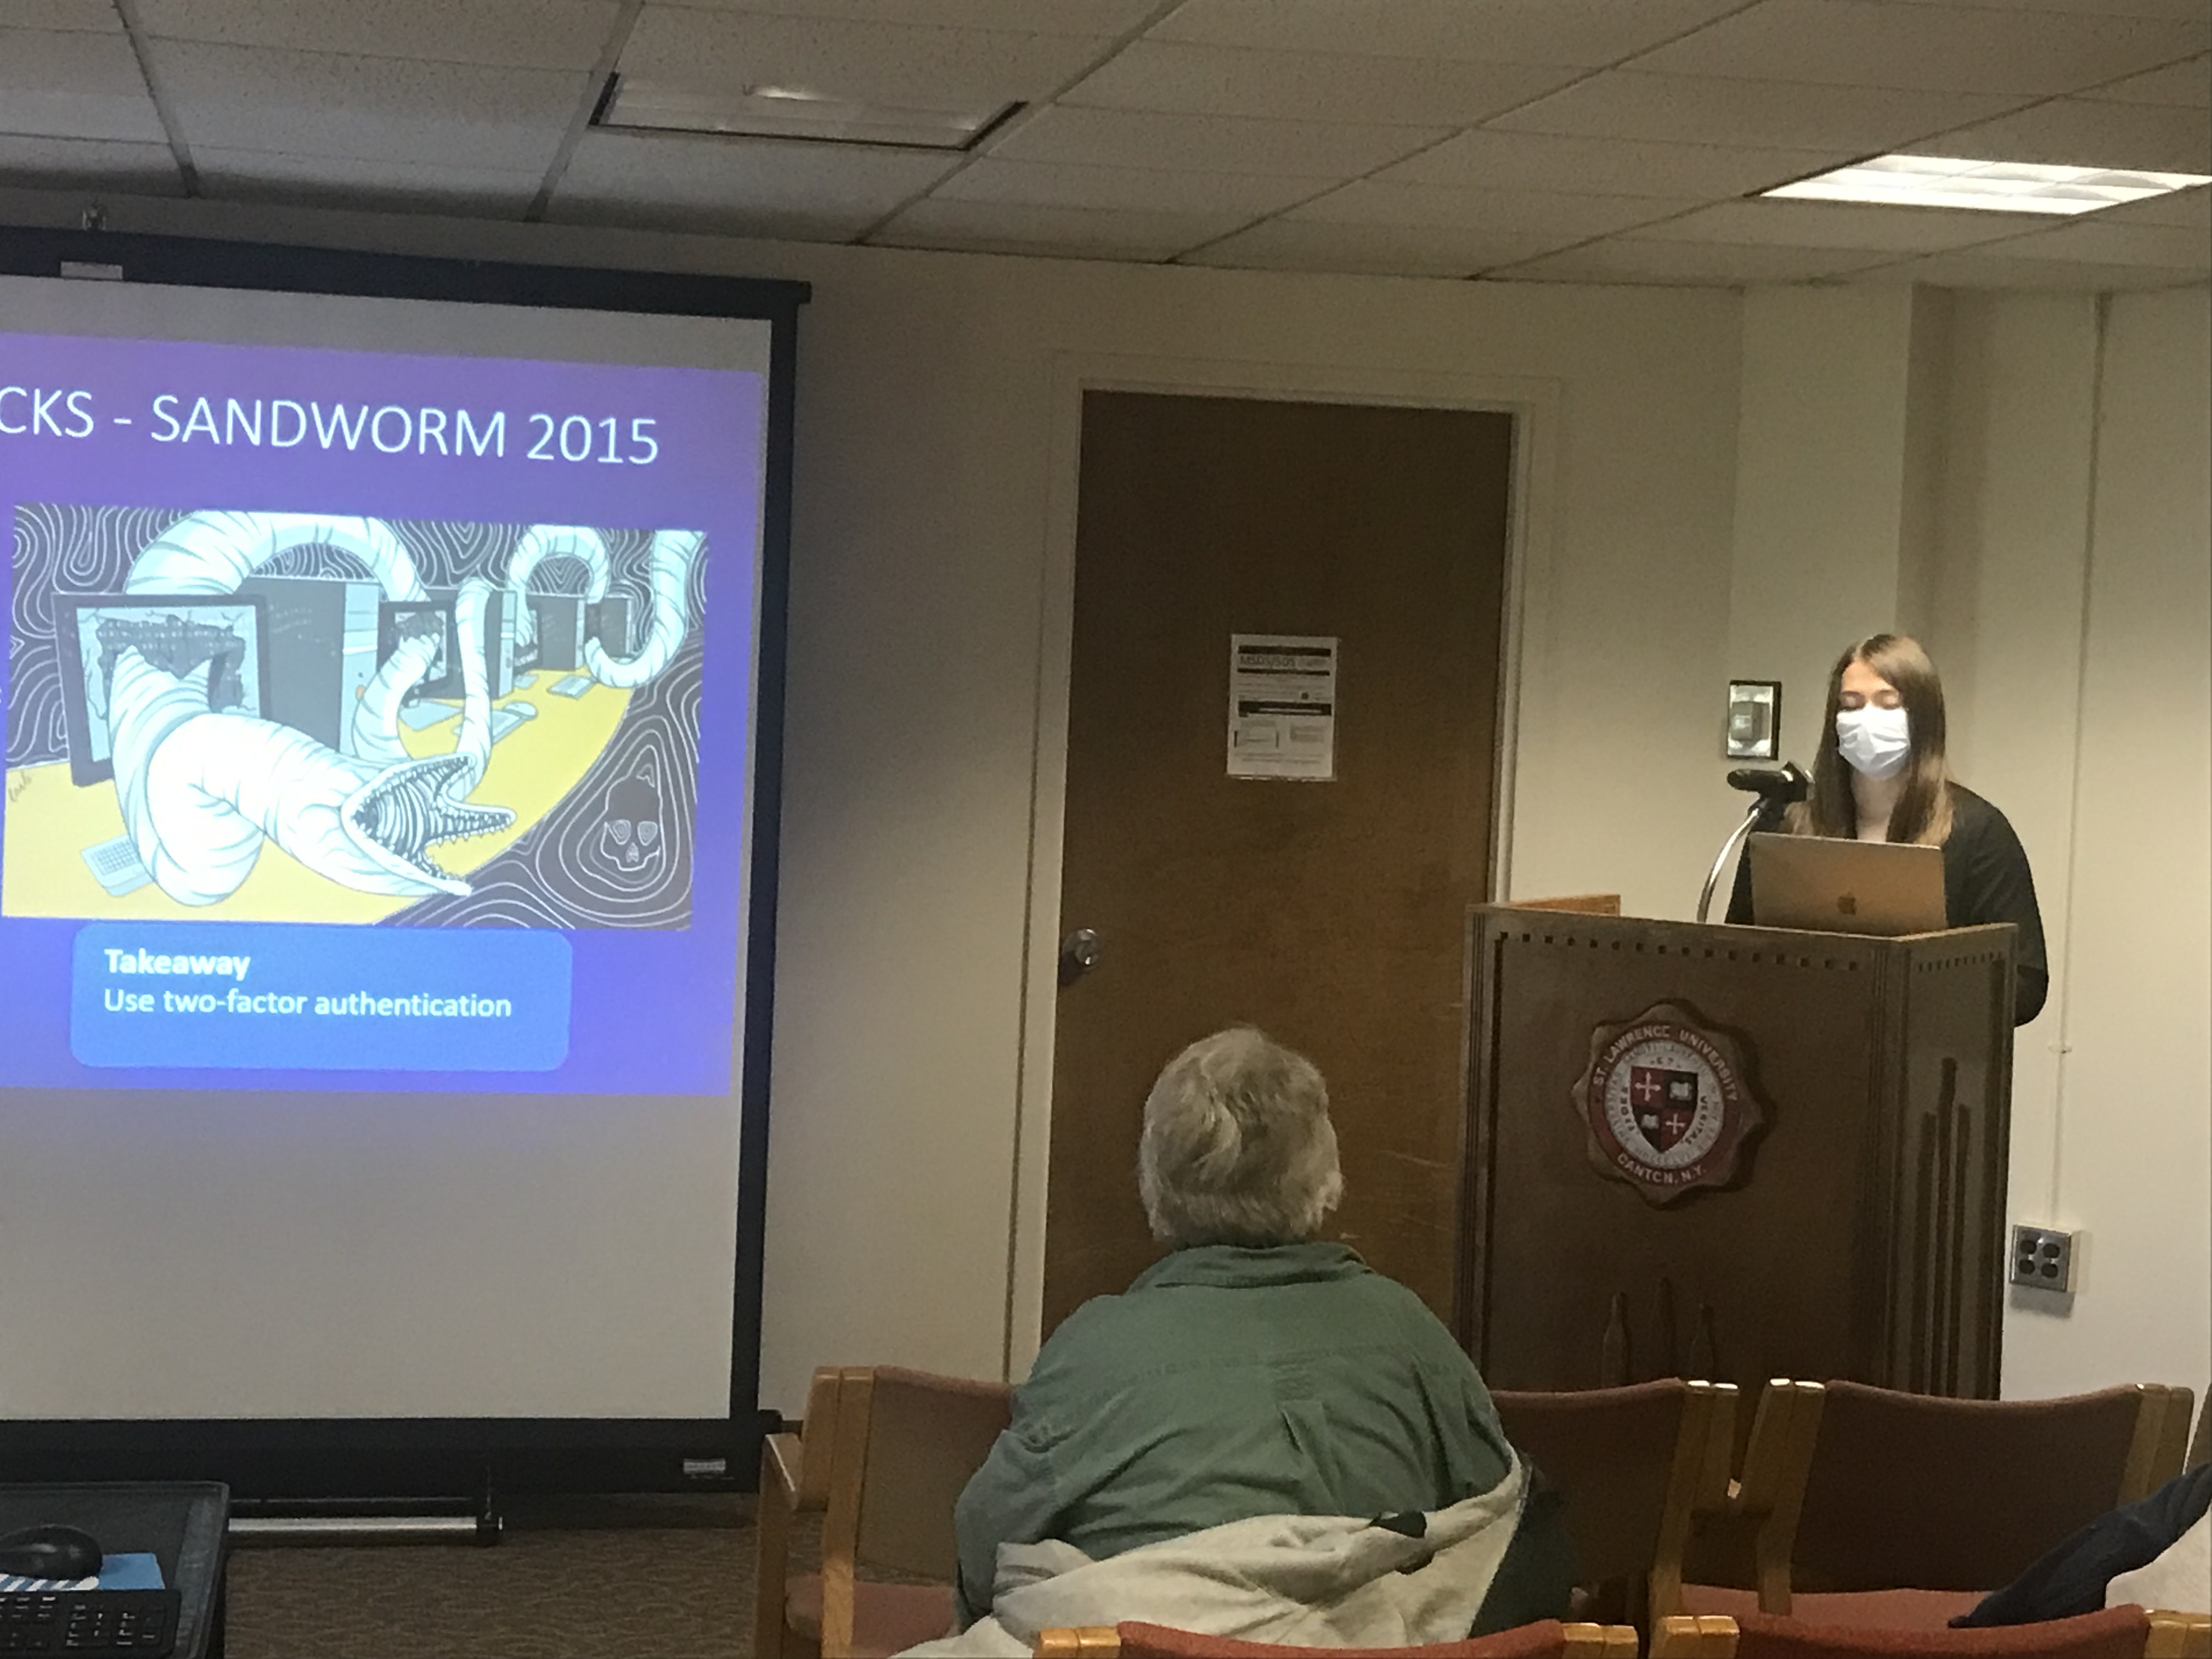
“Cyber Warfare in 2022: How Your Misclick Turned Out the Lights in Ukraine”
Abstract: While thousands of people lose their lives in the ongoing Ukraine-Russia conflict, hacktivists and nation-state malware have expanded the battlefield to the fifth domain: digital. Worming through foreign networks, hackers have spread misinformation, prevented refugees from crossing borders, caused blackouts across Ukraine, and escalated the war beyond combatant countries’ military targets. Belarus and Russia’s techniques to exploit security vulnerabilities are far from new, but their impact is substantial nonetheless. This presentation will discuss what makes these countries’ denial of service attacks, wiper malware, and phishing schemes unique, as well as Ukraine’s unprecedented, crowd-sourced cyber response. Join Kimberly Merchant in her CS SYE presentation to find out what’s happening in Ukraine’s networks, how hard it is to attribute attacks to a nation-state, and why cyberattacks aren’t escalating.
Hans Nsengimana, Ganesh Petterson, and Kailani Lemieux Mack, Faculty Ed Harcourt, Computer Science
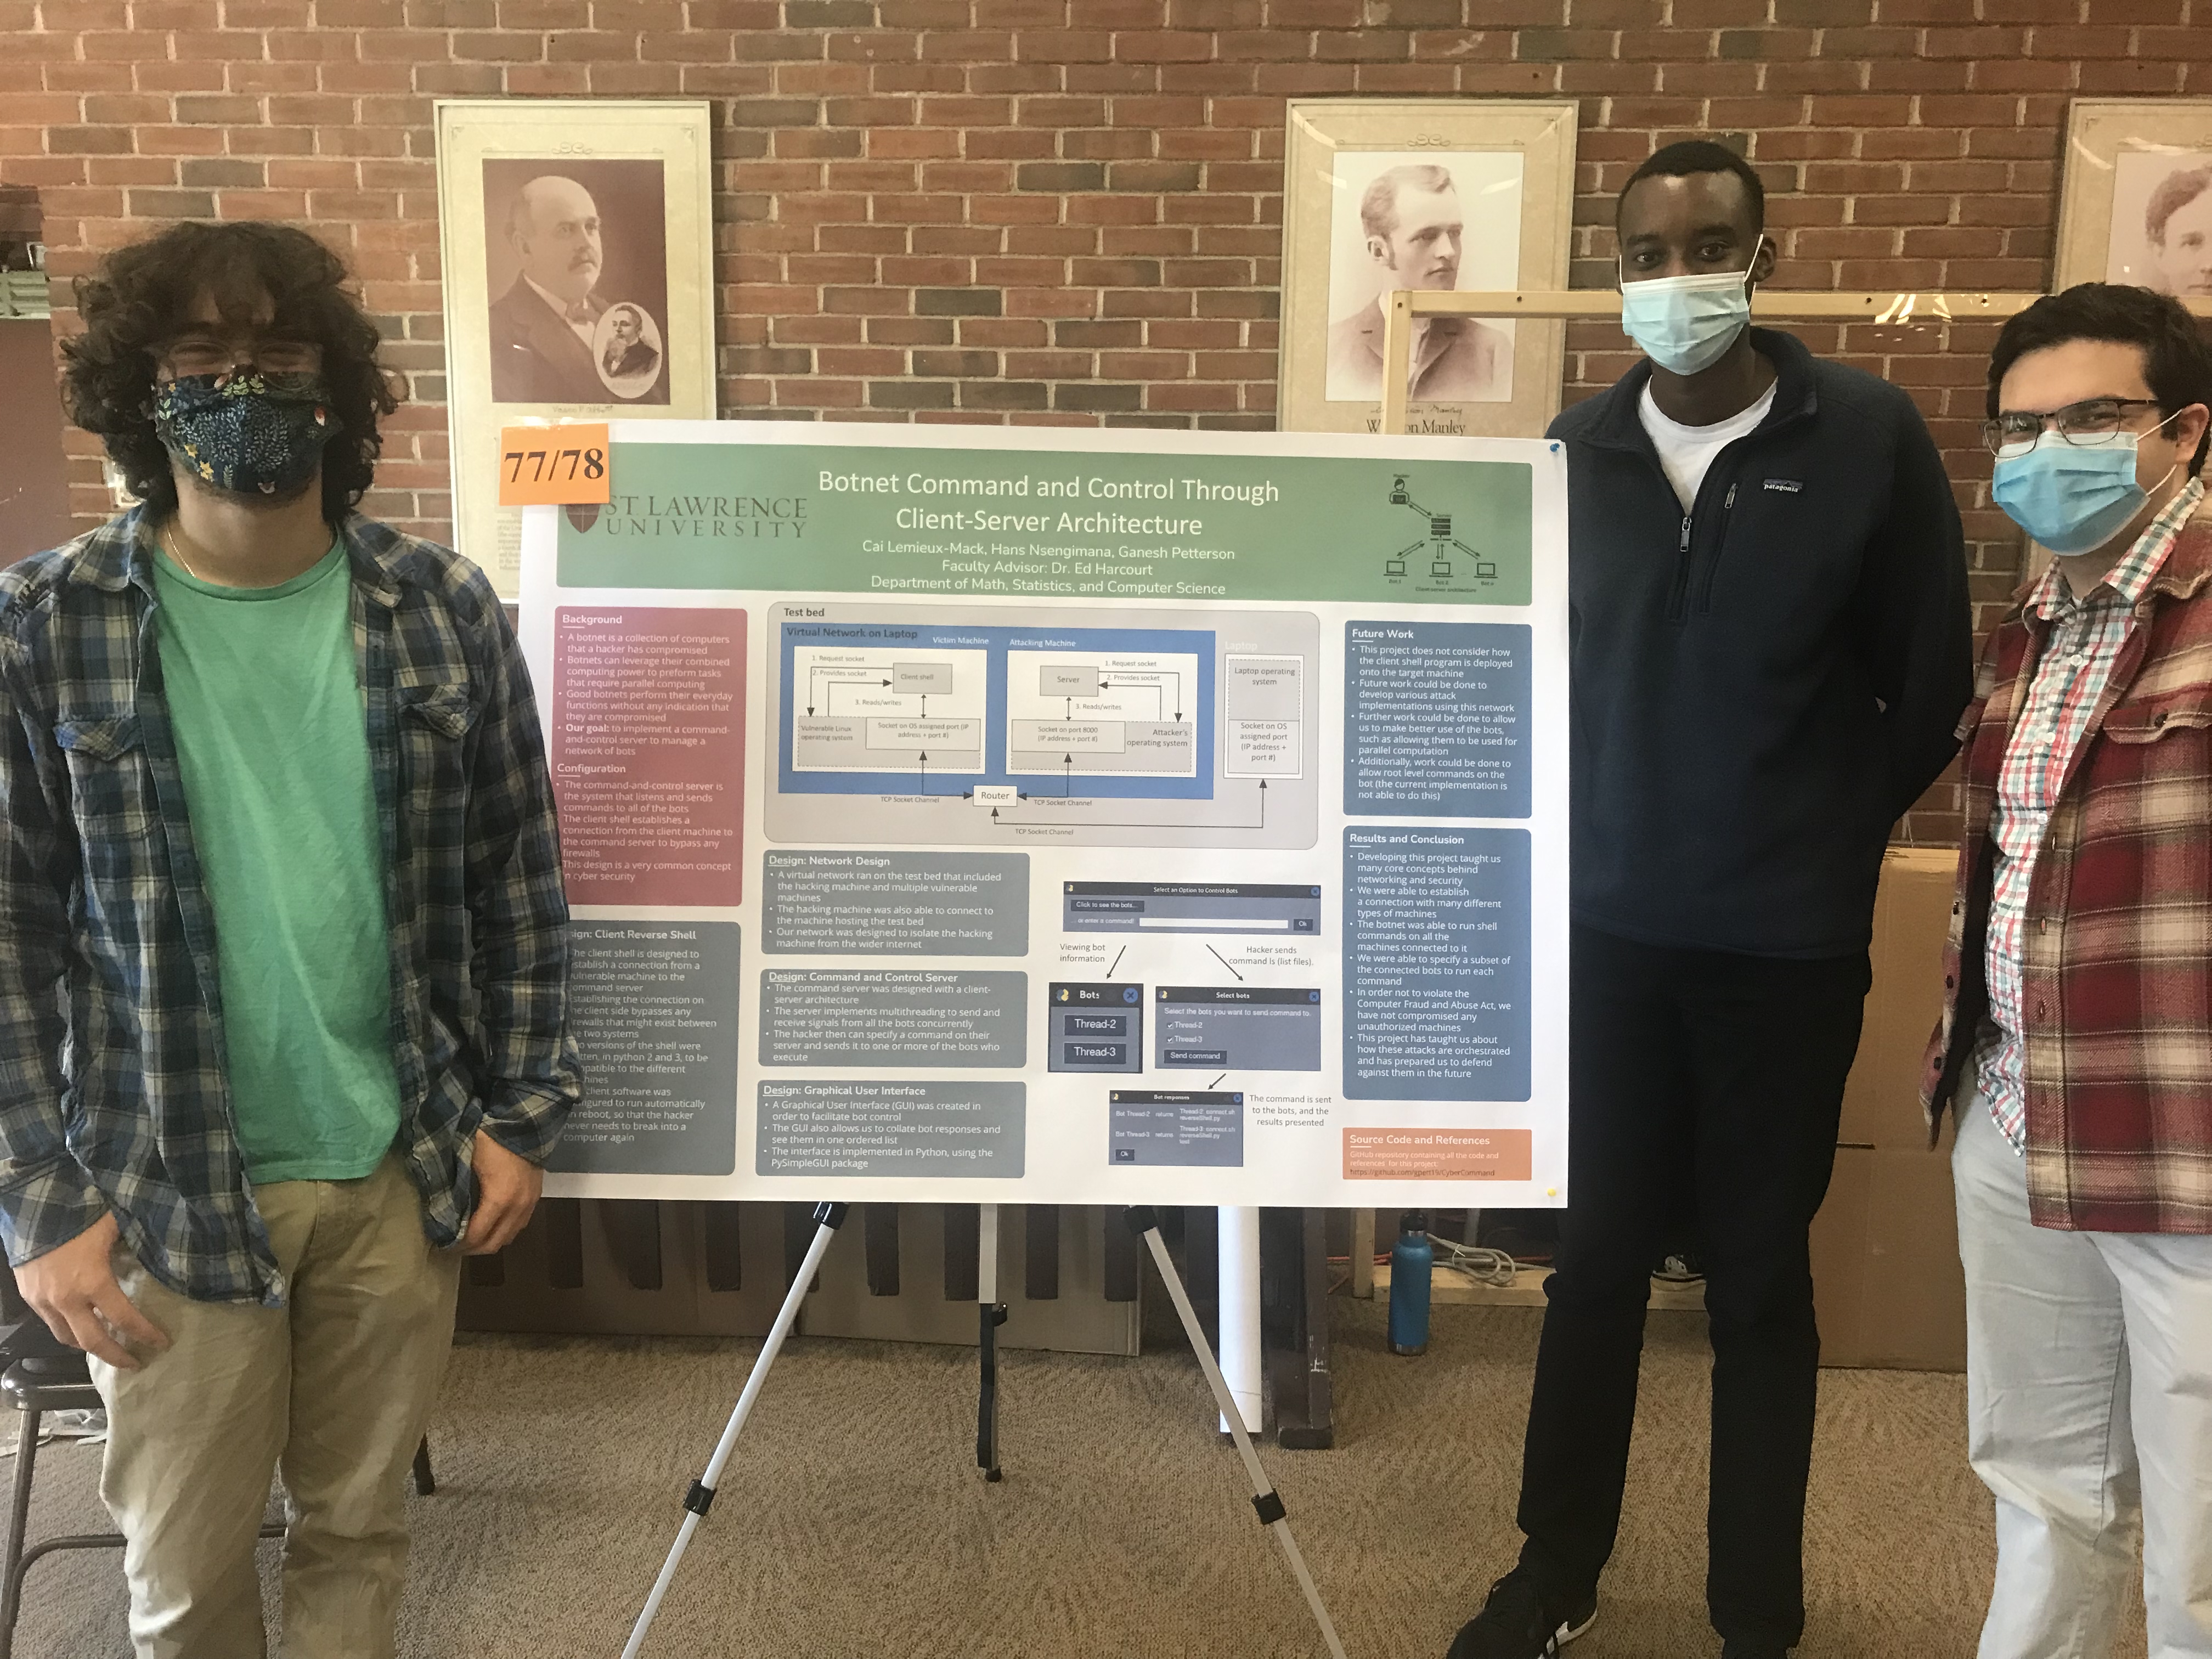
“Botnet Command and Control Through Client-Server Architecture”
Abstract: In 2016, users found themselves unable to access websites such as Twitter, PayPal, Spotify, and many others, as a result of a Distributed Denial of Service (DDoS) attack on major US infrastructure company Dyn. The goal of such an attack is to overwhelm a website with traffic from different sources in order to cause a crash. The most common tool for this is a botnet, a collection of computers (or “bots”) that a hacker has compromised and can leverage at any time to achieve a goal, such as a DDoS attack or bitcoin mining. These bots range from personal computers to research machines, all without any indication that they are compromised.
The central element of a botnet is a server run by the hacker that commands the connected machines. This server design is called a command and control server and has many different applications in computer science. However, many recent uses have been as part of large-scale cyber attacks in order to monitor and control infected machines.
In order to better understand these technologies, we have implemented our own command and control server, as well as the software that gets uploaded to vulnerable machines to turn them into bots. We have been able to control multiple machines at the same time. In order not to violate the Computer Fraud and Abuse Act, we have not compromised any unauthorized machines. This project has taught us about how these attacks are orchestrated and has prepared us to defend against them in the future.
Tom Zhang, Faculty Sponsors Choong-Soo Lee and Ivan Ramler, Data Science
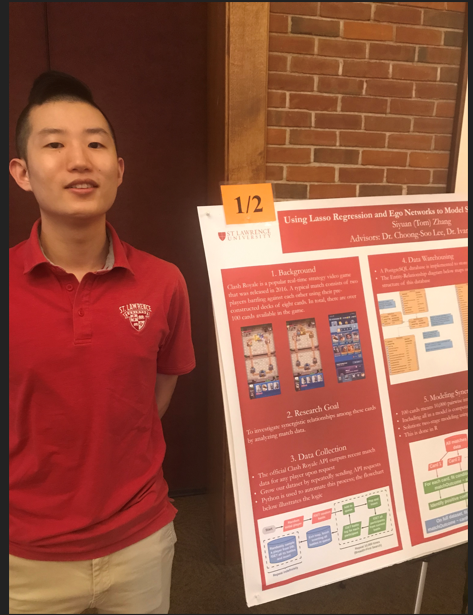
“Using Ego Networks and Lasso Regression to Model Synergy in Clash Royale”
Abstract: Clash Royale is a popular real-time strategy video game that was released in 2016. A typical match consists of two players battling against each other using their pre-constructed decks of eight cards. In total, there are over 100 cards available in the game. The goal of our project is to investigate synergistic relationships among these cards by analyzing match data. We developed a method involving lasso regression and ego networks to model and visualize the over 10,000 possible interactions between cards. Some notable technical aspects involved: implementing a data collection pipeline with Python, designing a PostgreSQL database, training regression models in R, and building a web app with JavaScript to showcase the final results. This nontrivial project illustrates how a video game can be made academic. Further, the processes and techniques utilized are not limited to esports analytics and could be applied to disciplines with similarly structured data.

Eduardo Puerta, Faculty Daniel Look, Mathematics
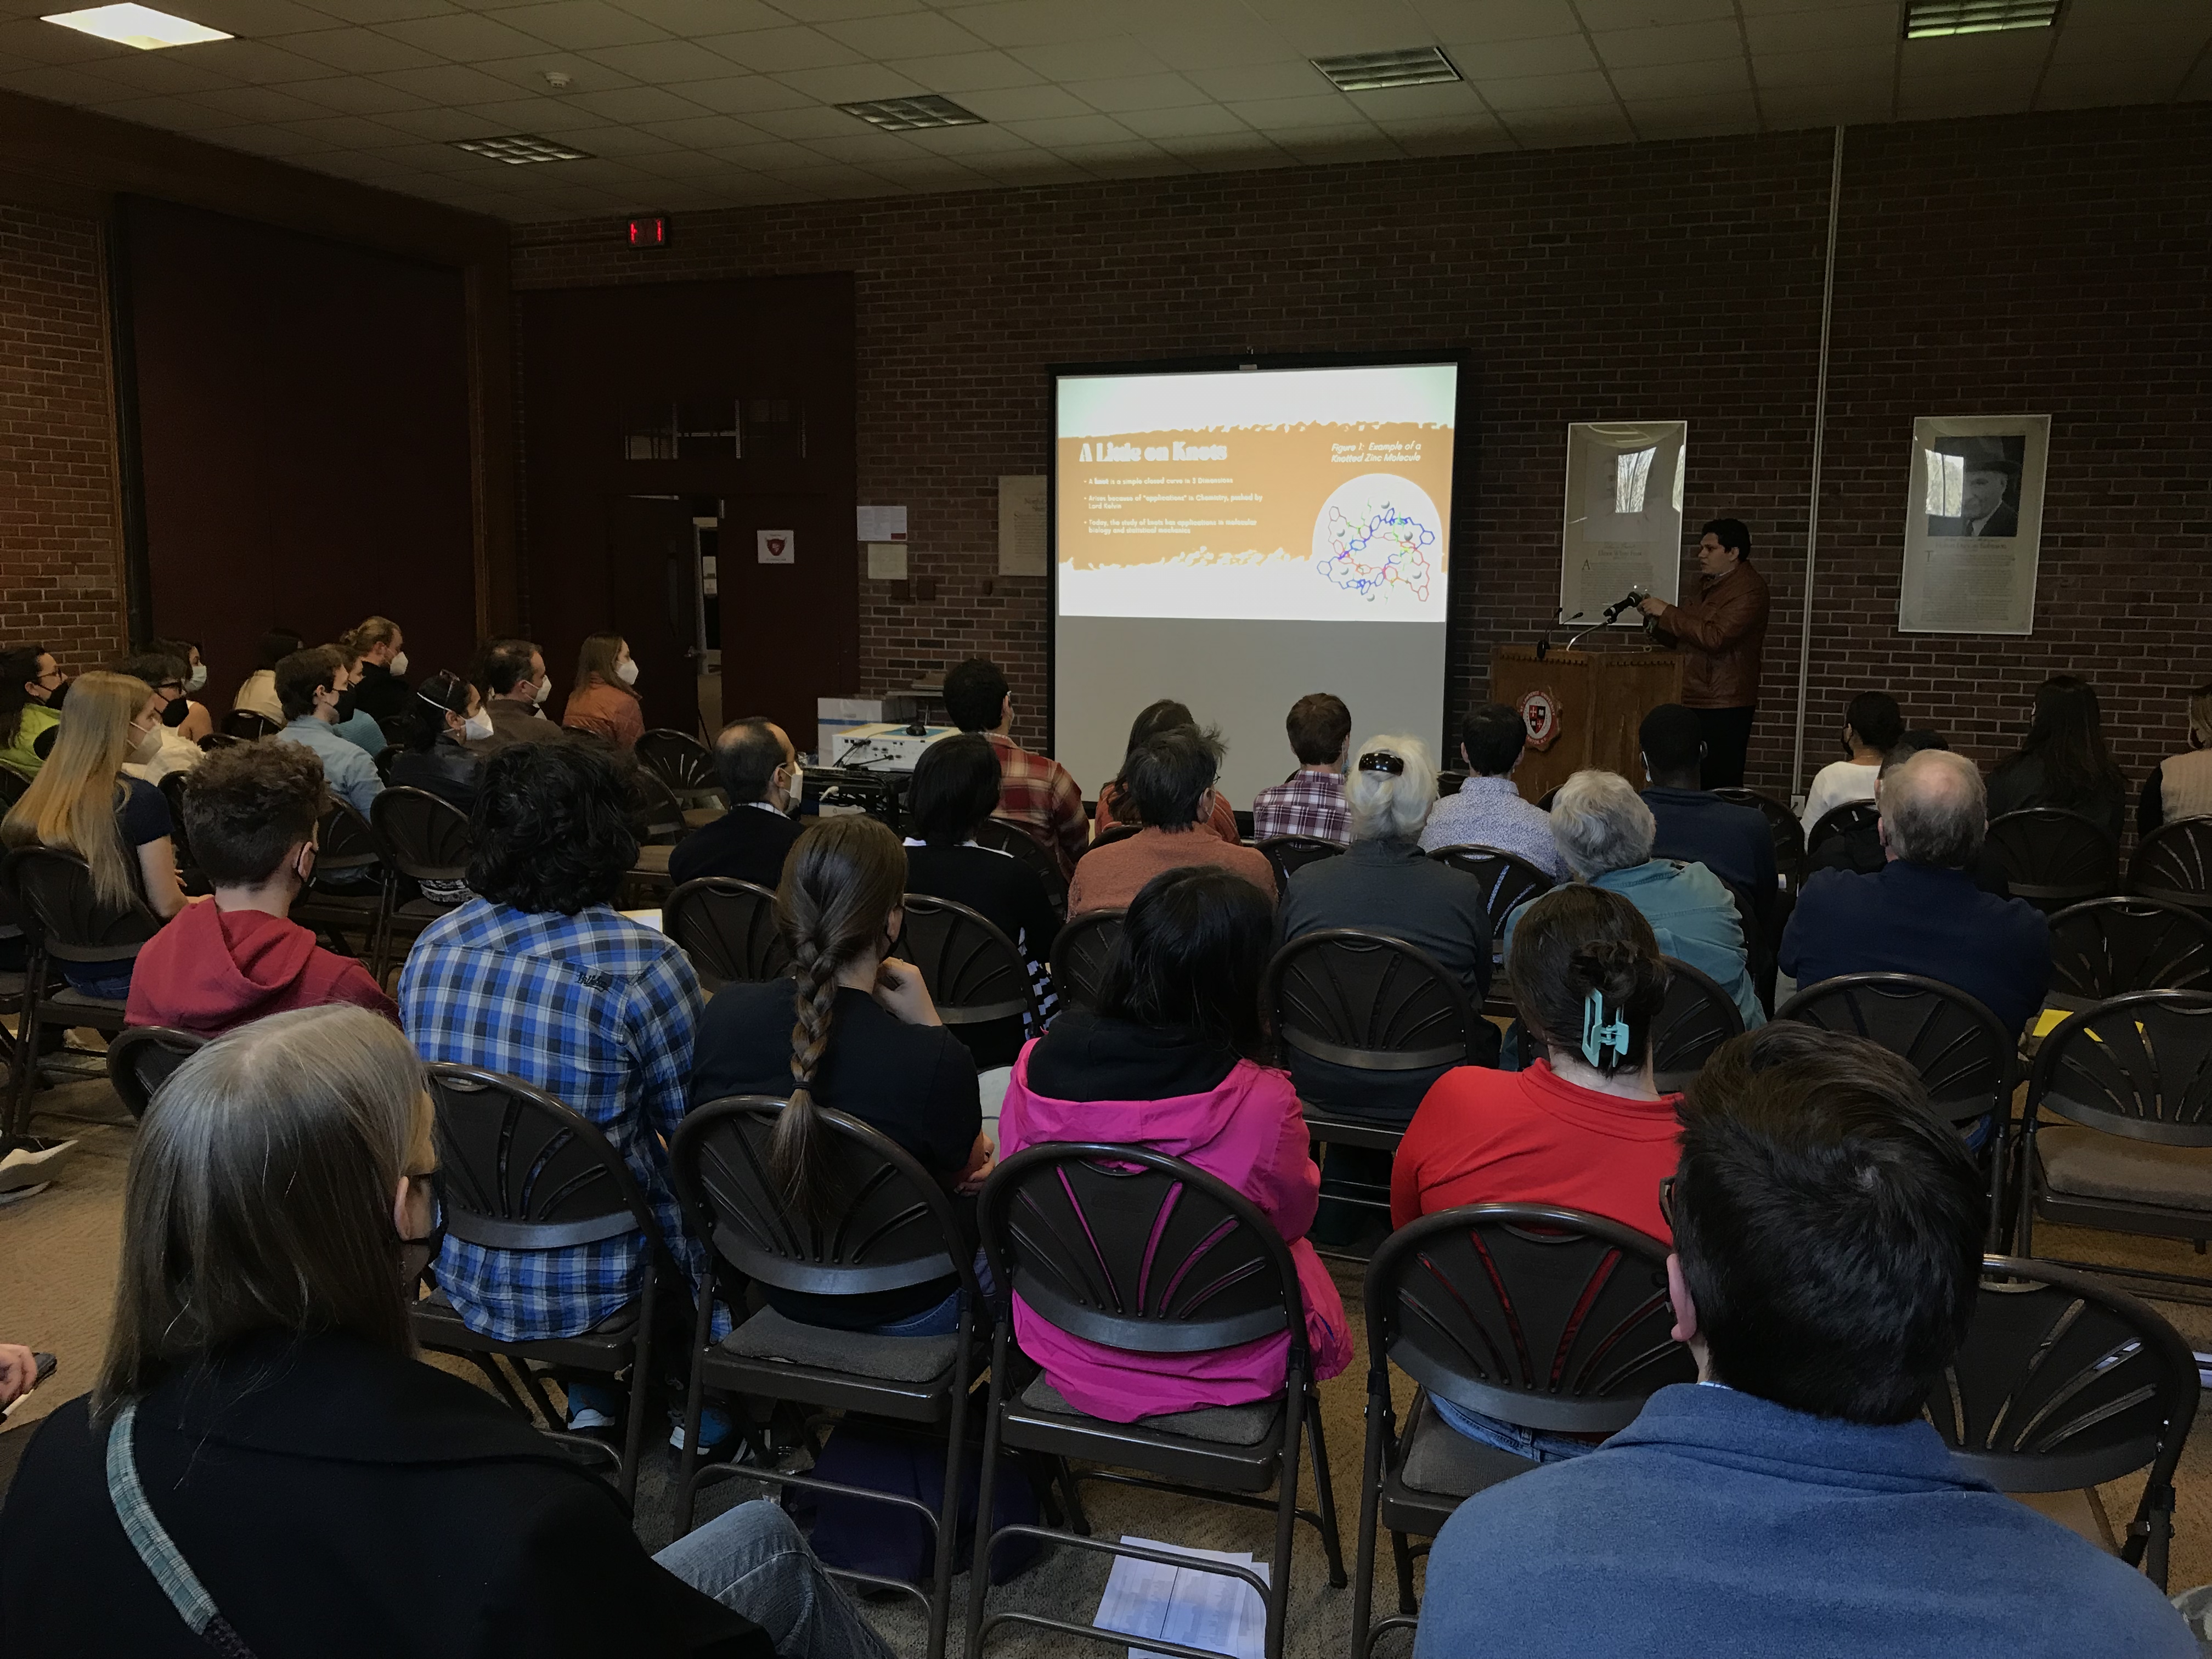
“The Knot Determinant: A Linkage of Linear Algebra and Topology”
Abstract: Knot theory is a sub-field of topology focusing on the classification and properties of mathematical knots. The study of knots has applications in statistical mechanics, molecular biology, and DNA unfolding. Intuitively, mathematical knots can be viewed as knotted strings where the ends are glued together to form a knotted loop. Much of knot theory revolves around distinguishing knots from each other. This talk will explore basic knot theory with the goal of motivating a concept known as the knot determinant, an invariant used to distinguish knots. Namely, we will discuss how methods in linear algebra simplified a problem in coloring knots, and how this insight helped build stronger classification tools. We will also explore how to calculate this determinant and interpret the value in the context of a given knot. Finally, we close by discussing research on the relationships between the knot determinant and other properties of knots, namely planar graph representation of knots.
Graham Branch and Perez Ortega Kevin, Faculty Maegan Bos, Mathematics
“Mathematics of Origami”
Abstract: Many mathematicians have explored the links between art of origami and the study of mathematics. We aim to explore some of these connections through our artwork. Over the course of the semester, we have been focusing our study on figure and modular origami. We will present many links to the mathematical world while showing the large body of work that we have made.
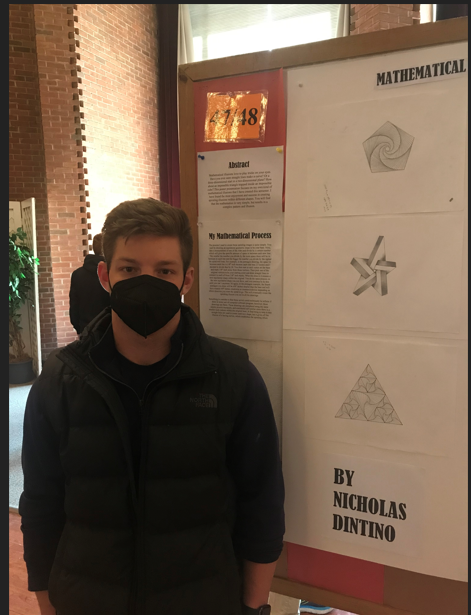
Nicholas Dintino, Faculty Maegan Bos, Mathematics
“Mathematical Illusions”
Abstract: Mathematical illusions love to play tricks on your eyes. Have you ever seen straight lines make a curve? Or a three-dimensional start in a two-dimensional plane? How about an impossible triangle trapped inside an impossible cube? This poster presentation focuses on my own kind of mathematical illusions that I have created this semester. I have found the most enjoyment and success in creating spiraling illusions within different shapes. You will find that the mathematics is very simple, but results in a complex pattern and illusion.
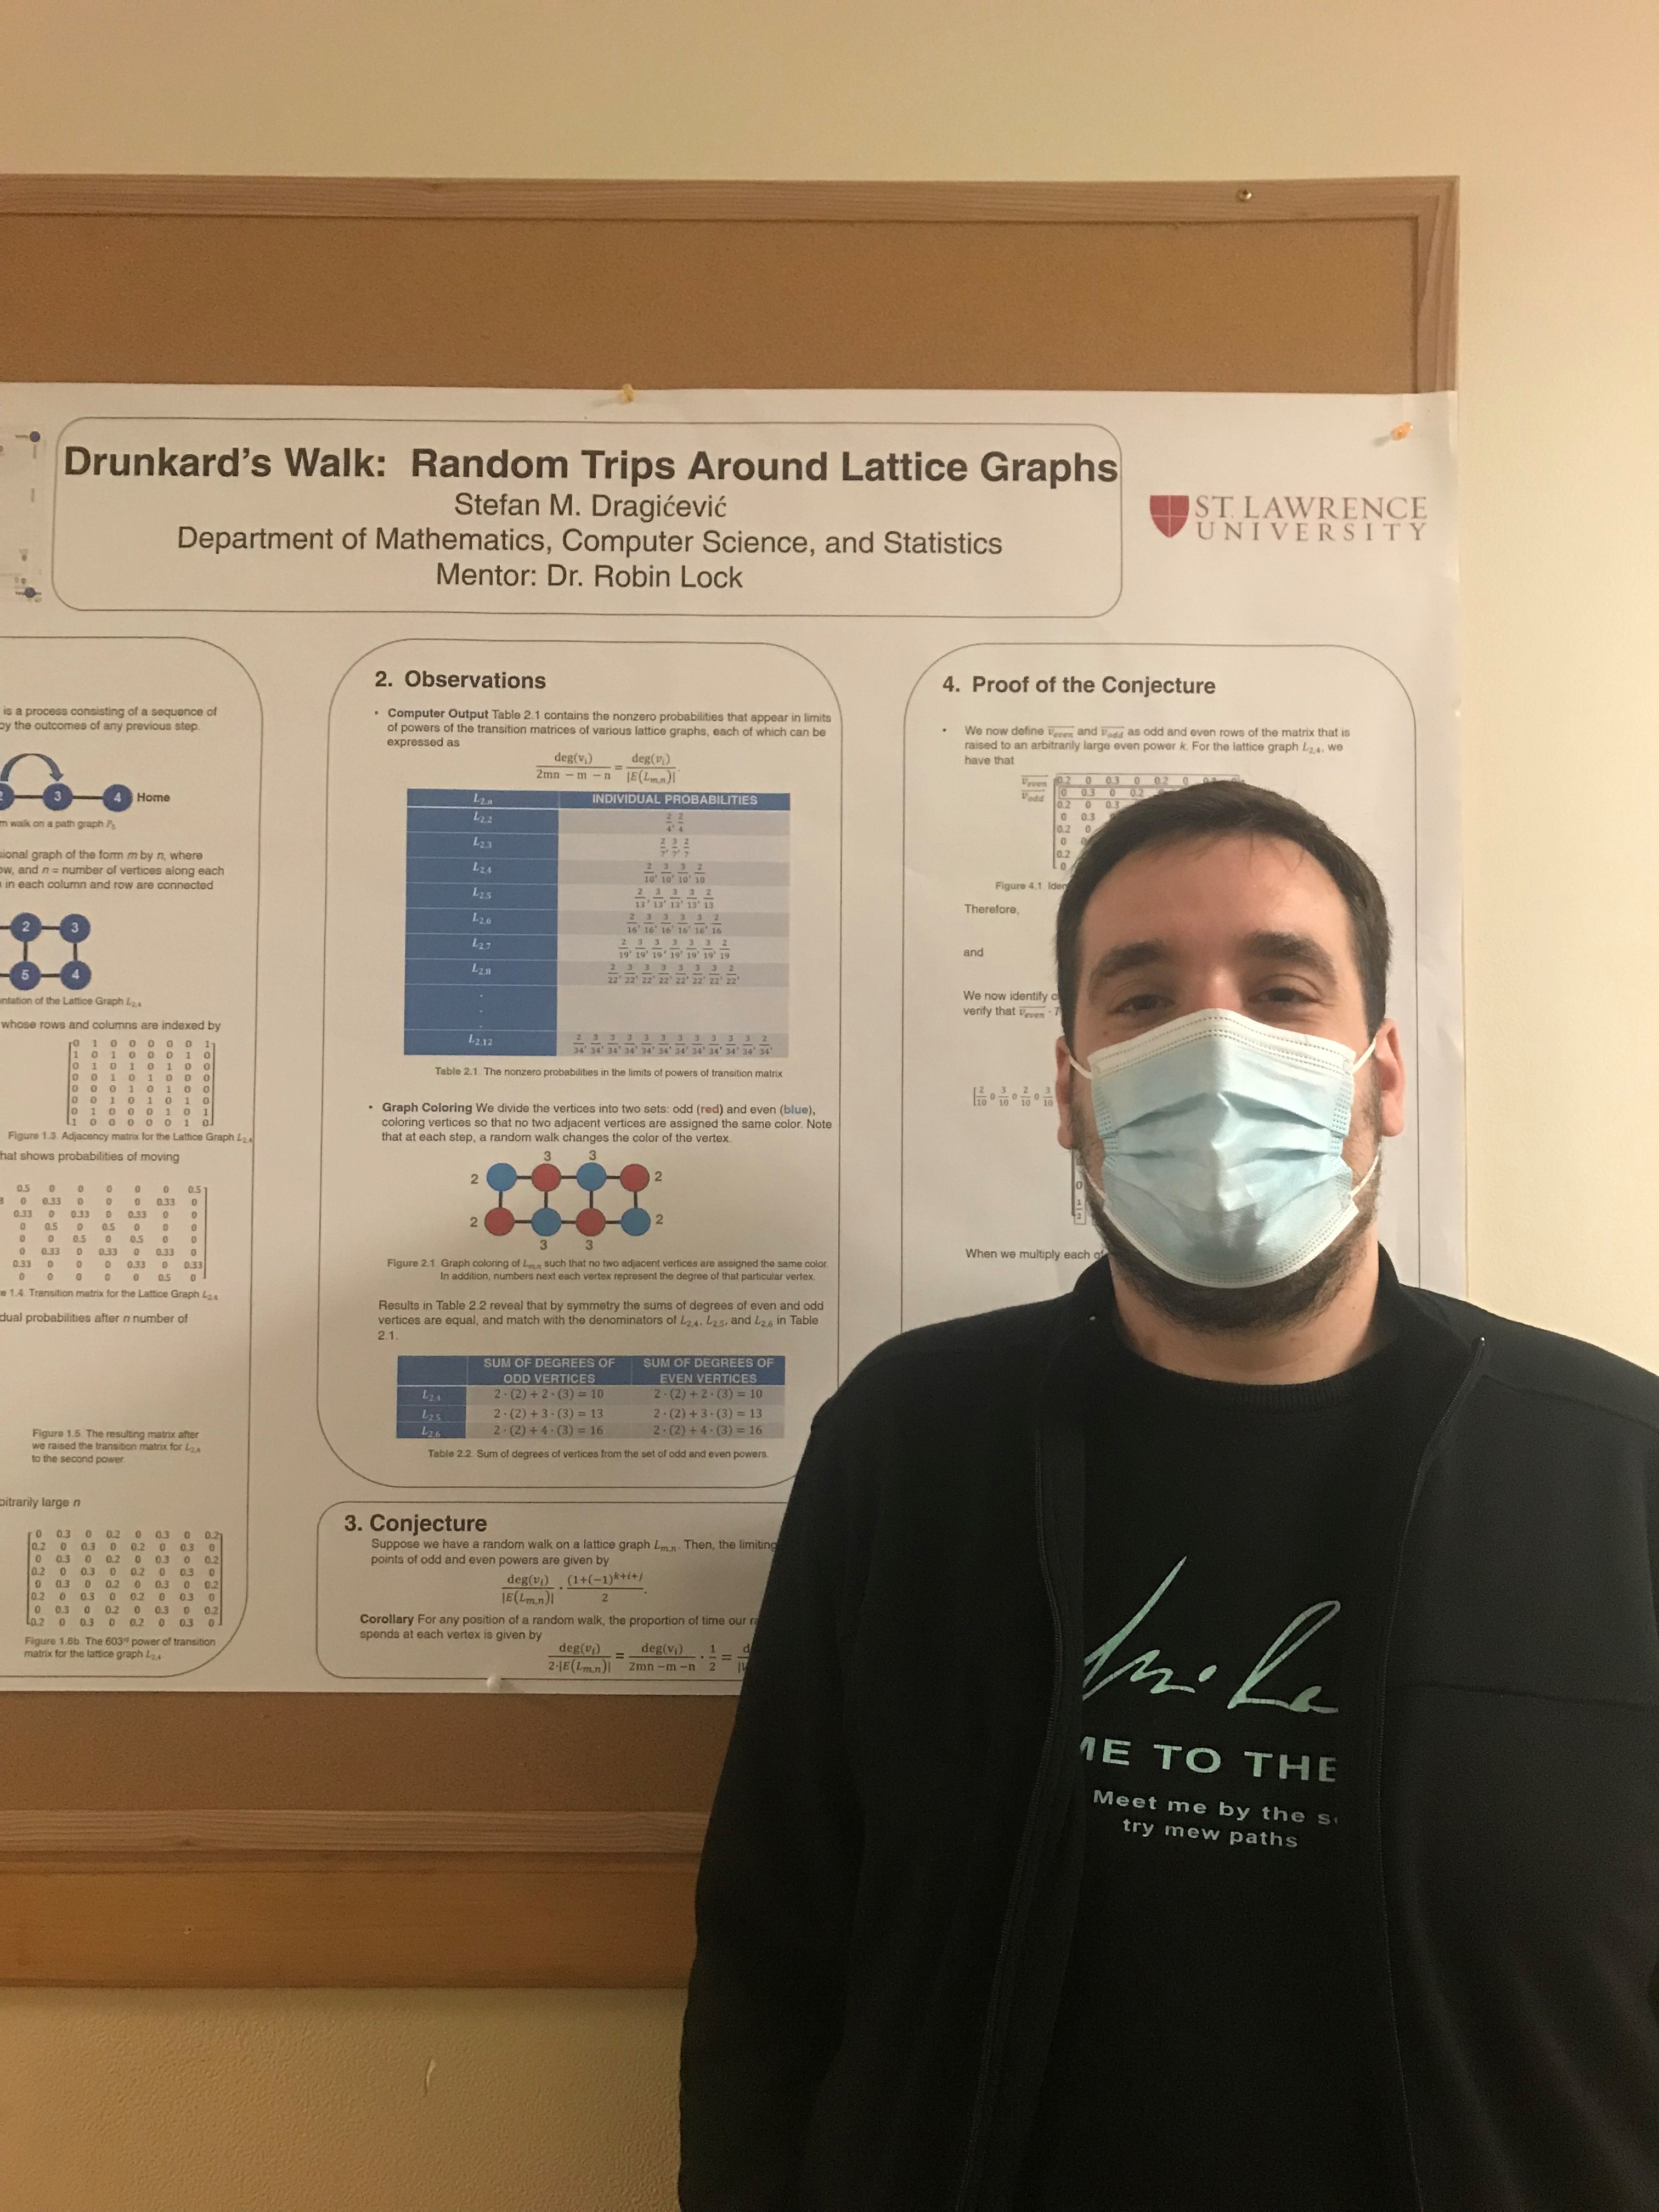
Stefan Dragicevic, Faculty Robin Lock, Mathematics
“Drunkard’s Walk: Random Tips Around Lattice Graphs”
Abstract: Mathematical illusions love to play tricks on your eyes. Have you ever seen straight lines make a curve? Or a three-dimensional start in a two-dimensional plane? How about an impossible triangle trapped inside an impossible cube? This poster presentation focuses on my own kind of mathematical illusions that I have created this semester. I have found the most enjoyment and success in creating spiraling illusions within different shapes. You will find that the mathematics is very simple, but results in a complex pattern and illusion.
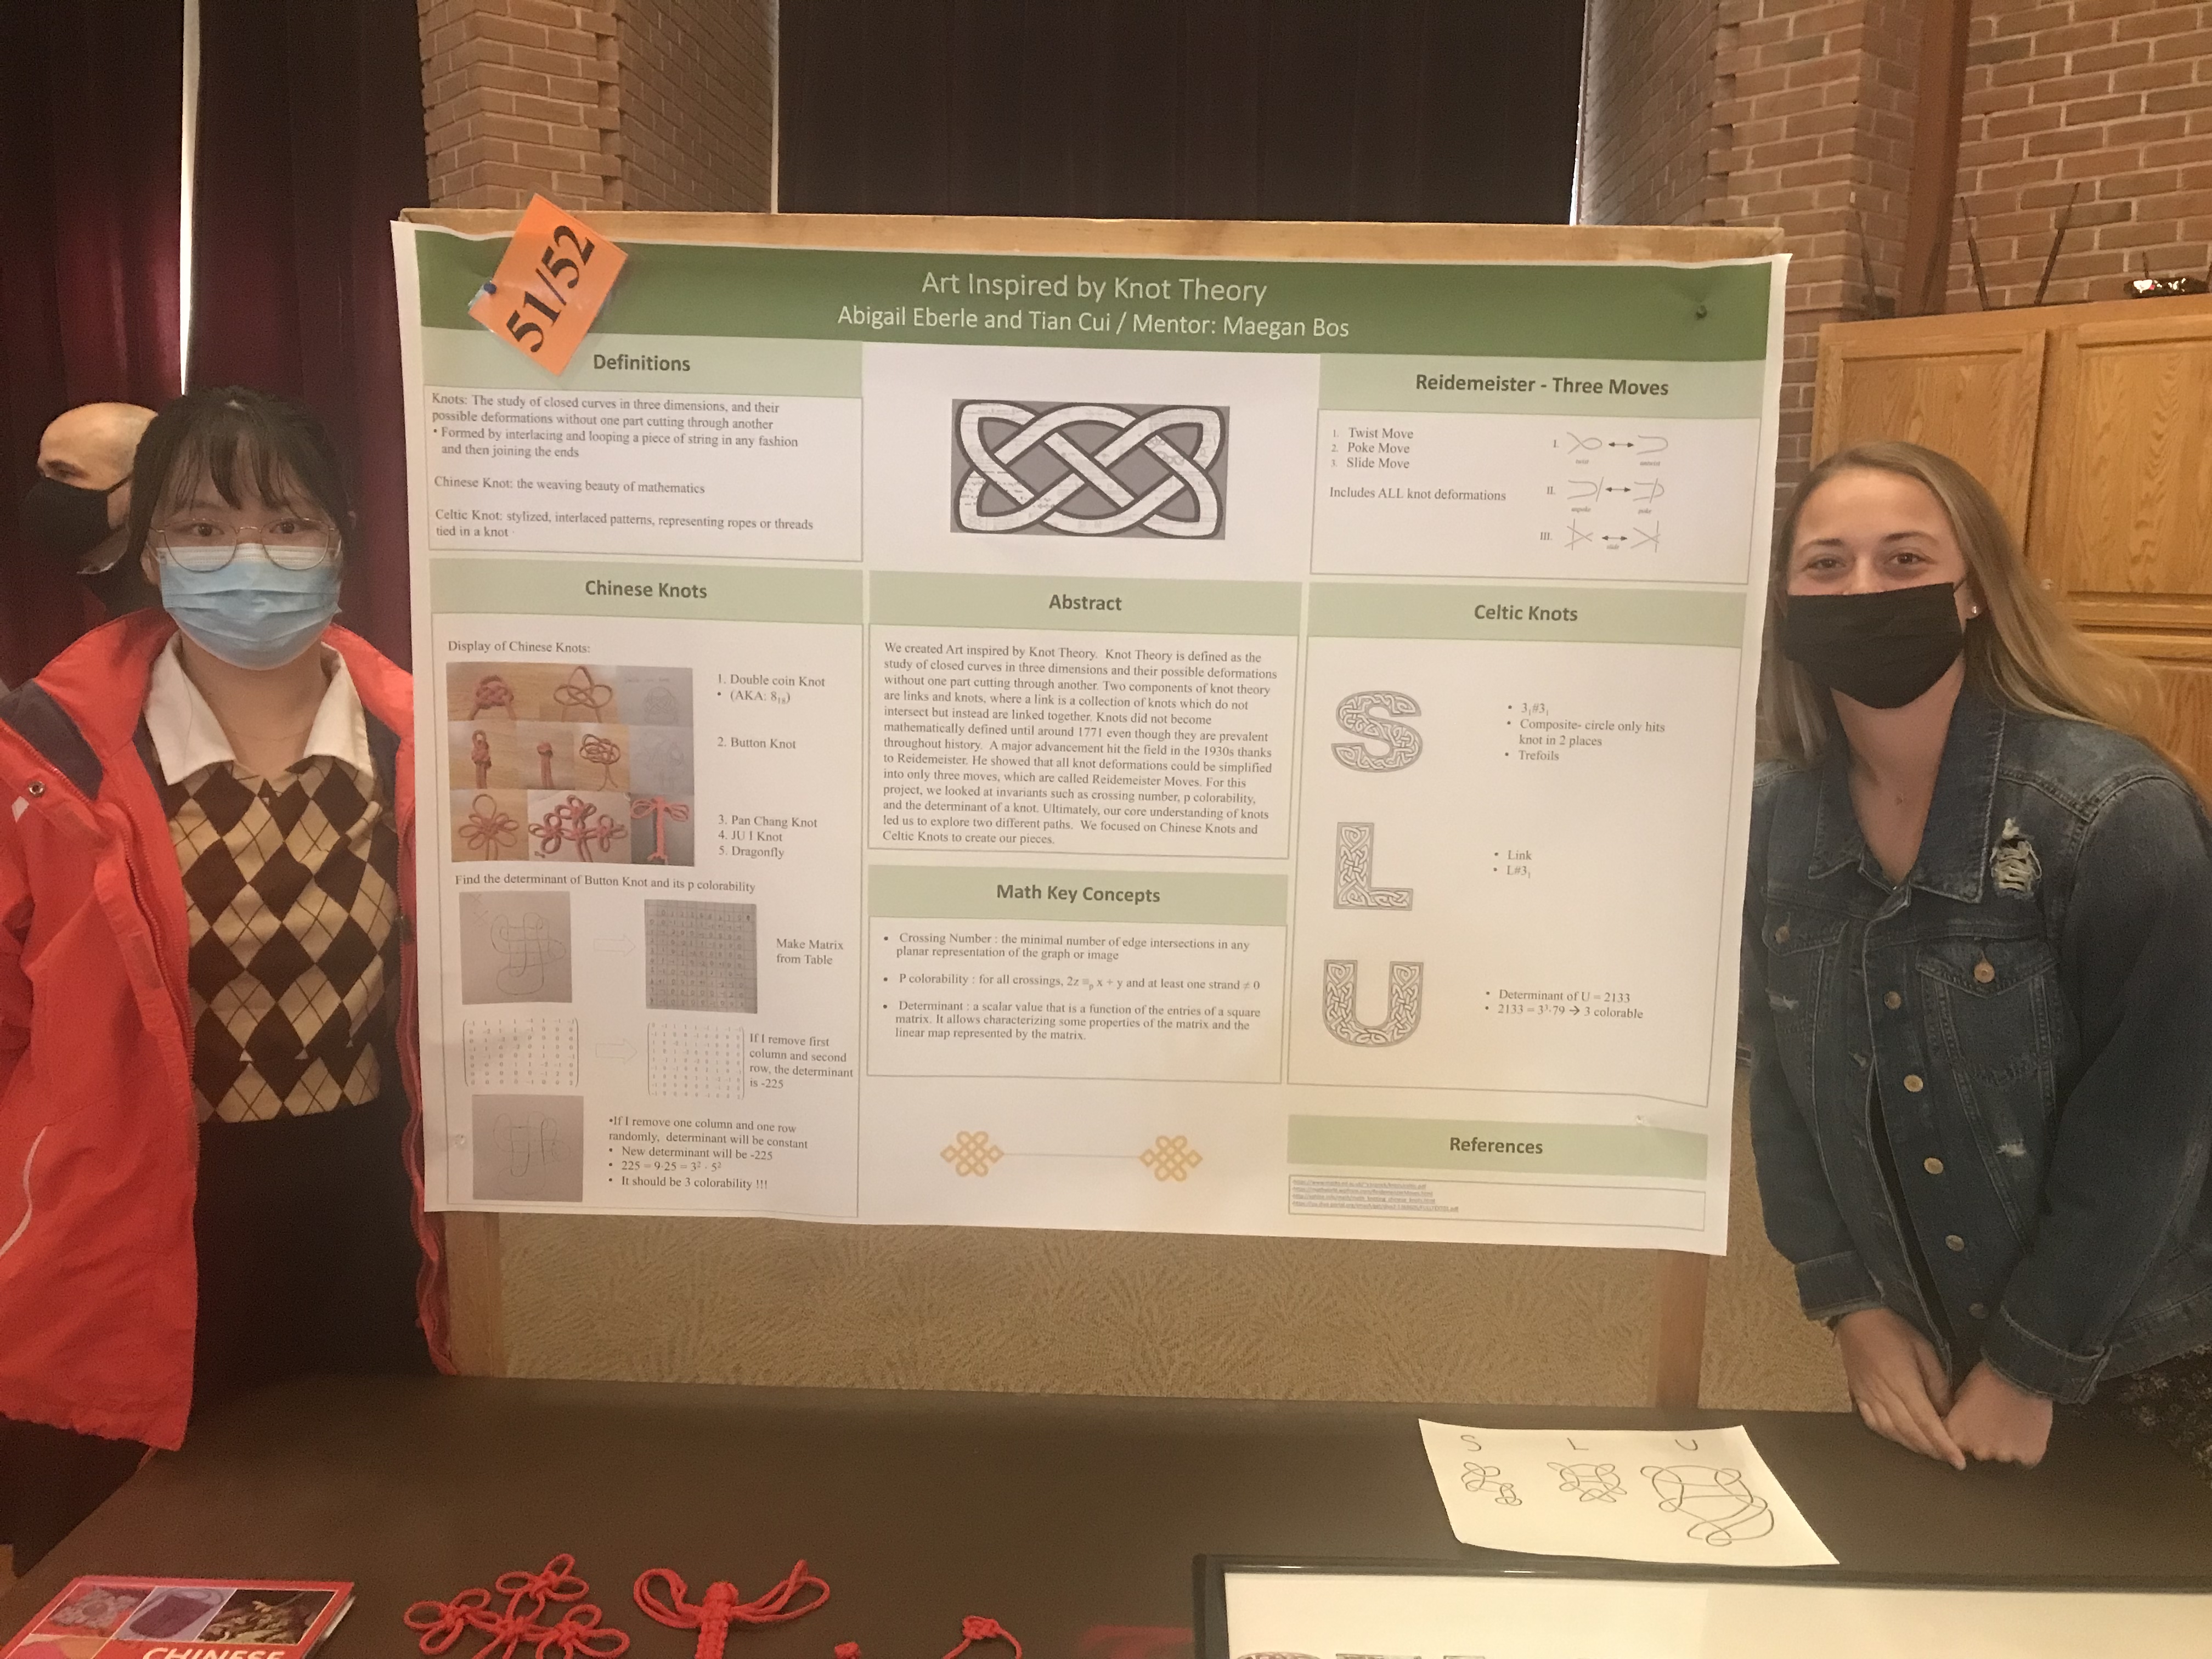
Abigail Eberle and Tian Cui, Faculty Maegan Bos, Mathematics
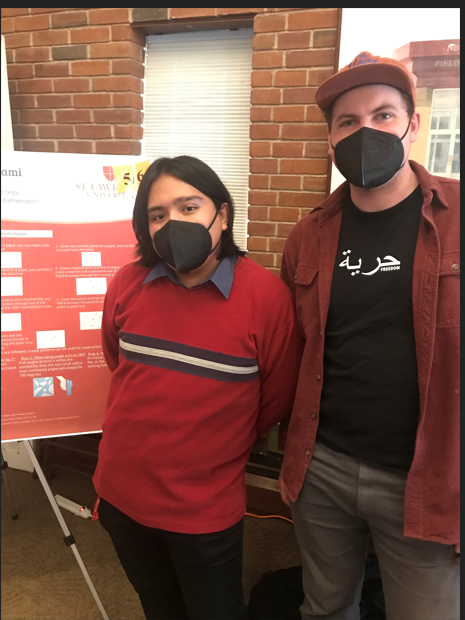
“Art Inspired by Knot Theory”
Abstract: We created Art inspired by Knot Theory. Knot Theory is defined as the study of closed curves in three dimensions and their possible deformations without one part cutting through another. Two components of knot theory are links and knots, where a link is a collection of knots which do not intersect but instead are linked together. Knots did not become mathematically defined until around 1771 even though they are prevalent throughout history. A major advancement hit the field in the 1930s thanks to Reidemeister. He showed that all knot deformations could be simplified into only three moves, which are called Reidemeister Moves. For this project, we looked at invariants such as crossing number, p colorability, and the determinant of a knot. Ultimately, our core understanding of knots led us to explore two different paths. We focused on Chinese Knots and Celtic Knots to create our pieces.
Malia MacDonald and Marlee Paterson, Faculty Maegan Bos, Mathematics
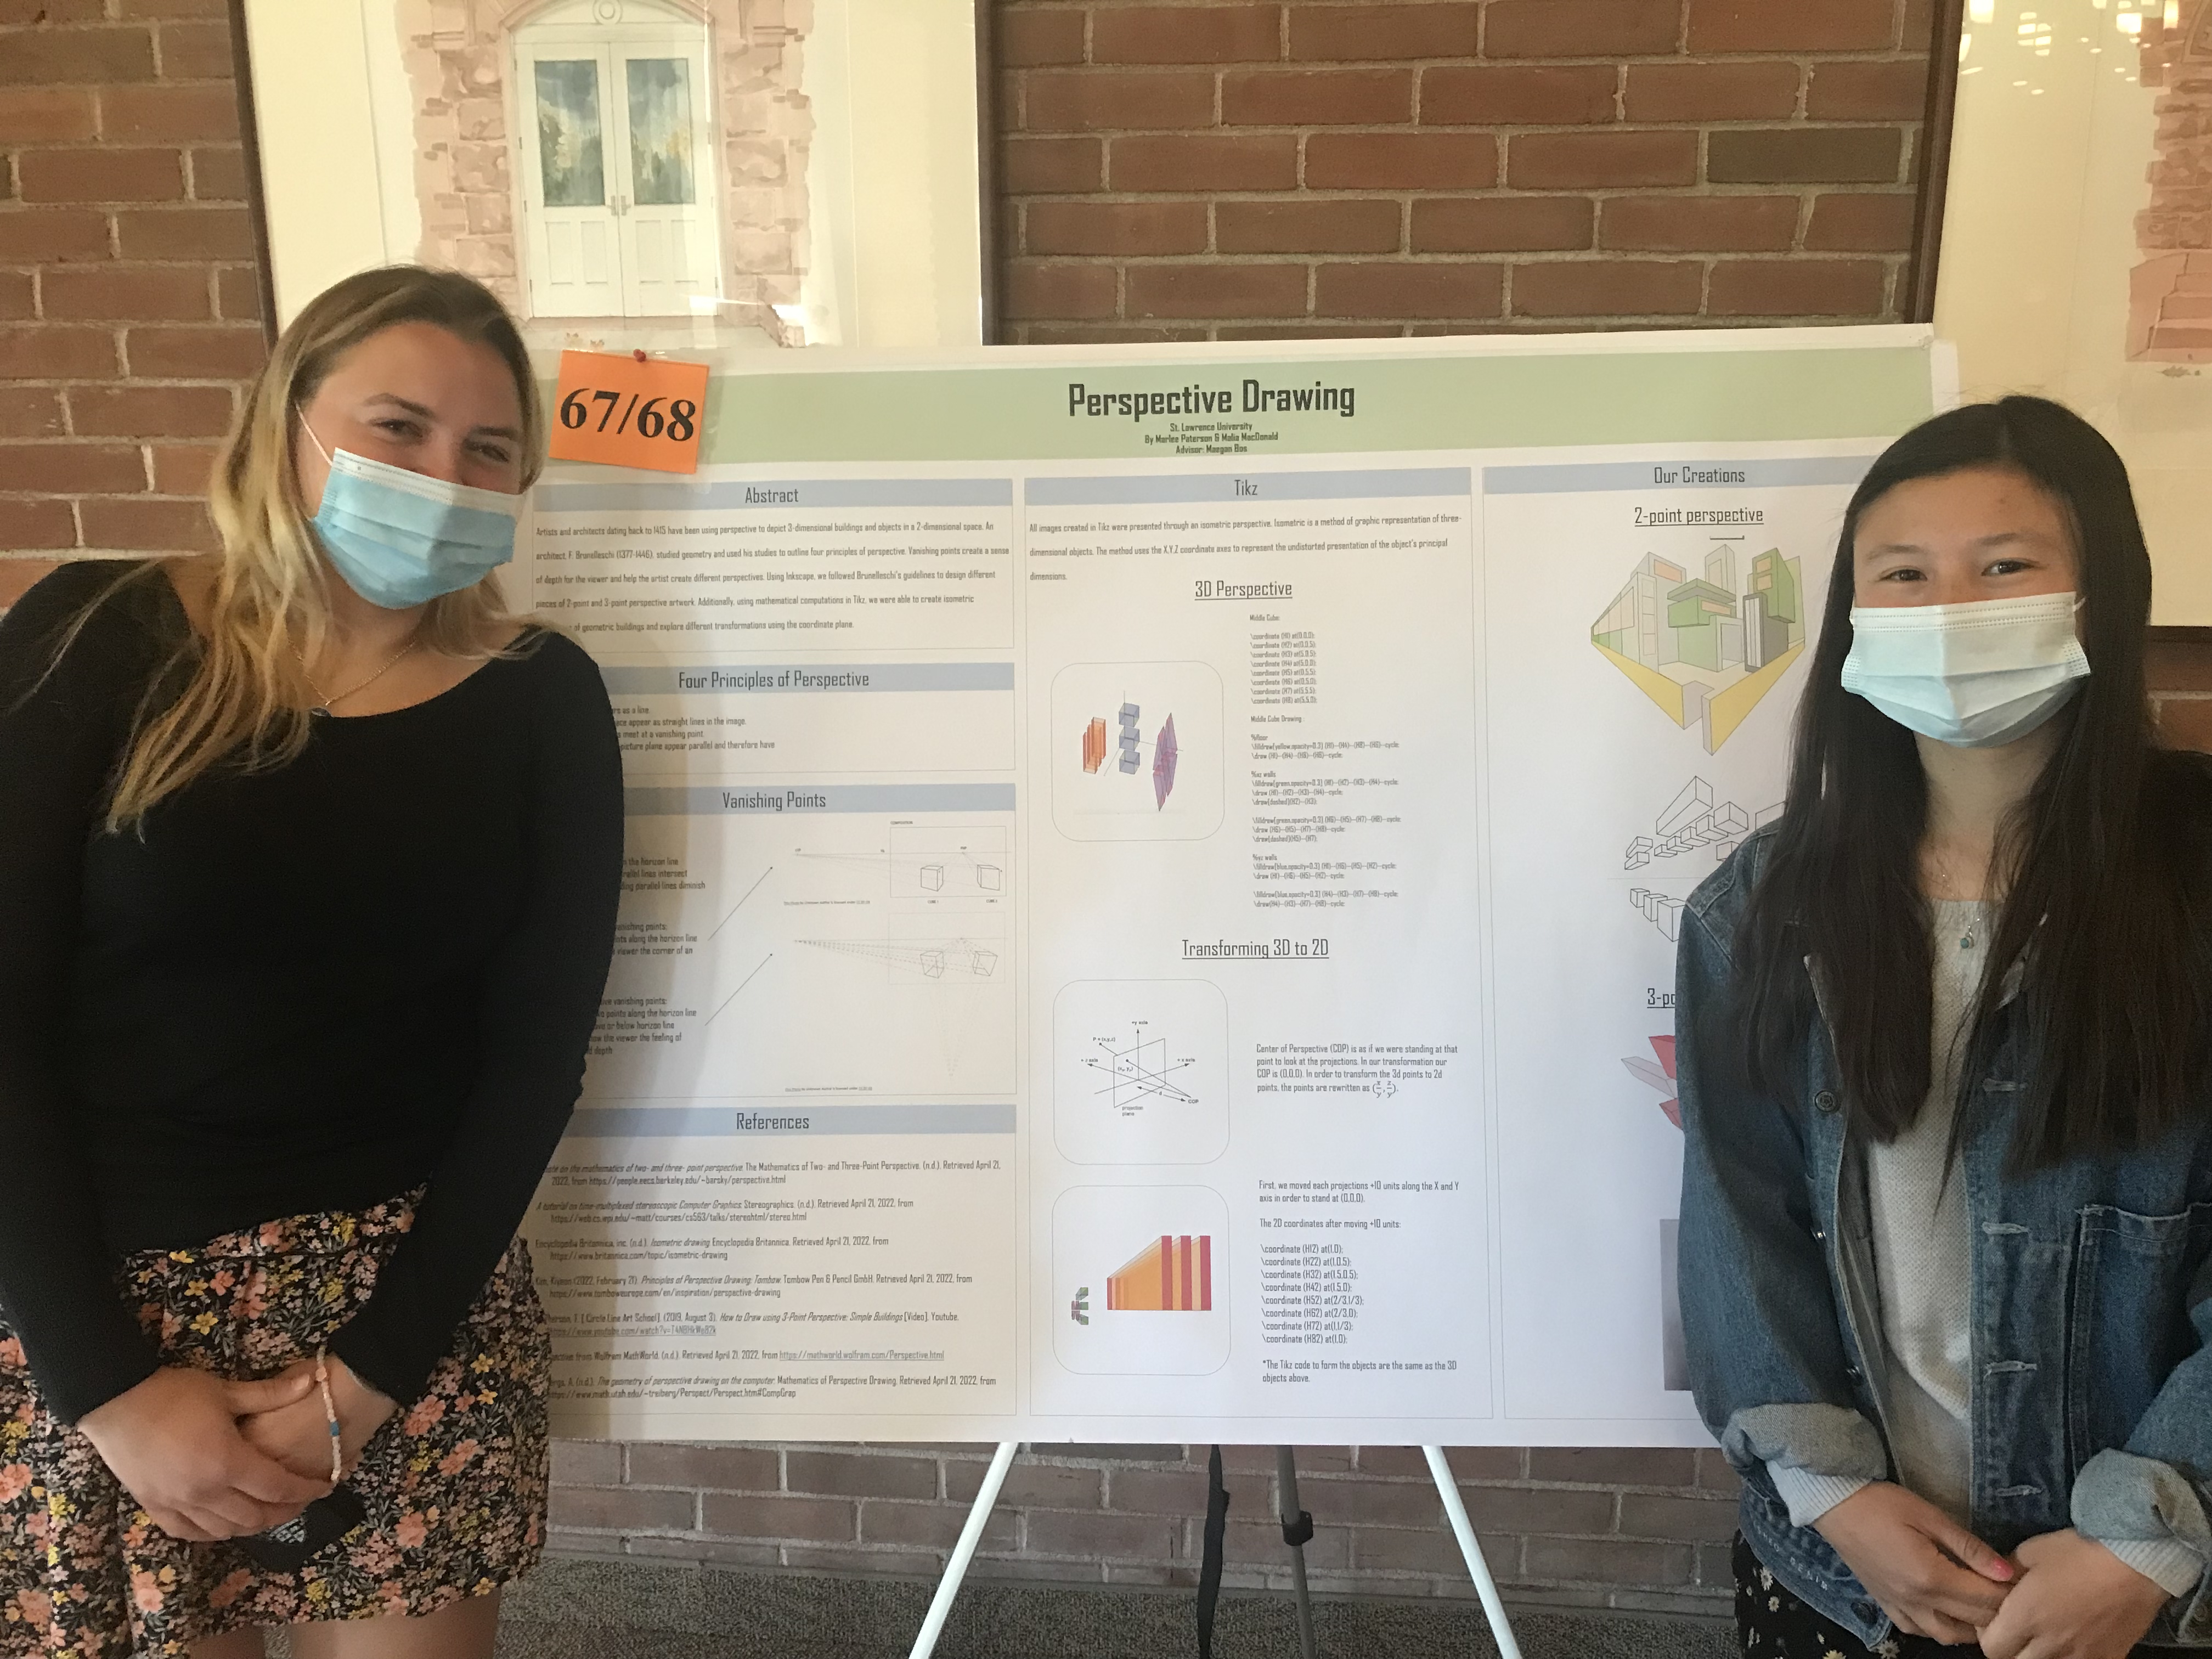
“Perspective”
Abstract: Artists and architects dating back to 1415 have been using perspective to depict 3-dimensional buildings and objects in a 2-dimensional space. An architect, F. Brunelleschi (1377-1446), studied geometry and used his studies to outline four principles of perspective. Vanishing points create a sense of depth for the viewer and help the artist create different perspectives. Using Inkscape, we followed Brunelleschi’s guidelines to design different pieces of 2-point and 3-point perspective artwork. Additionally, using mathematical computations in Tikz, we were able to create isometric projections of geometric buildings and explore different transformations using the coordinate plane.
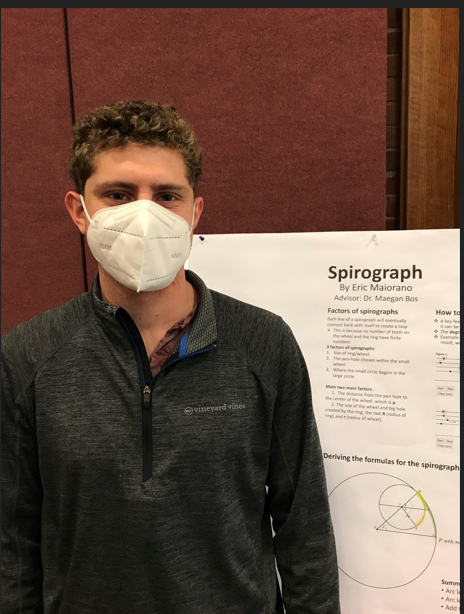
Eric Maiorano, Faculty Maegan Bos, Mathematics
“Math of Spirographs”
Abstract: I researched spirographs, they are used to create visuals that begin at the center of a ring and expand outwards. A spirograph consists of a wheel moving within a large ring. The materials consist of a writing utensil, paper, a small wheel, and a large ring. I will be investigating what makes spirographs predictable by determining its variables. To determine the outcome, some factors I focused on were: the distance from the pen-hole to the center of the cog, the radi R (radius of ring), and r (radius of wheel). It is important to understand these factors because it affects the types of visuals you create. I found how the degree of symmetry of a spirograph drawing will depend on R and r. In addition, changing the p value results in how sharp the loops are. Furthermore, my findings were significant because they allow the user to understand how to create specific designs.
Andrew Dykstra, Faculty Robin Lock, Mathematics
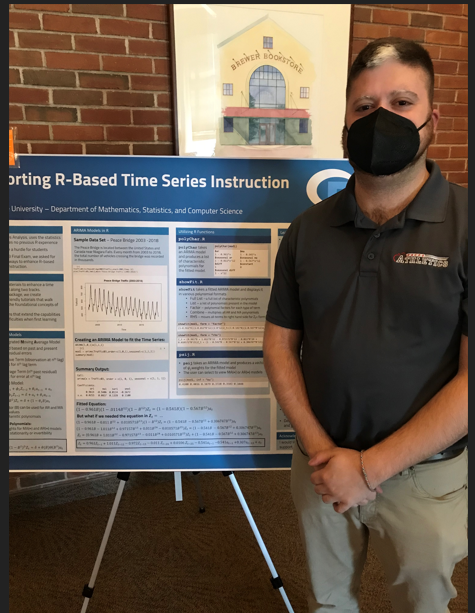
“Supporting R-Based Time Series Instruction”
Abstract: Our work to provide materials to enhance a time series course is divided into two tracks. First, using the LearnR package, we create interactive, user-friendly tutorials that walk students through the foundational concepts of R and RStudio such as basic account set-up, coding with R-Markdown files, and plotting time series. Second, we create functions, based on student feedback, that extend the capabilities of R to address difficulties when first learning time series. For example, polyChar and showFit are functions that display fitted ARIMA models in various polynomial formats. We have added these functions to a publicly available R package for instructional use.
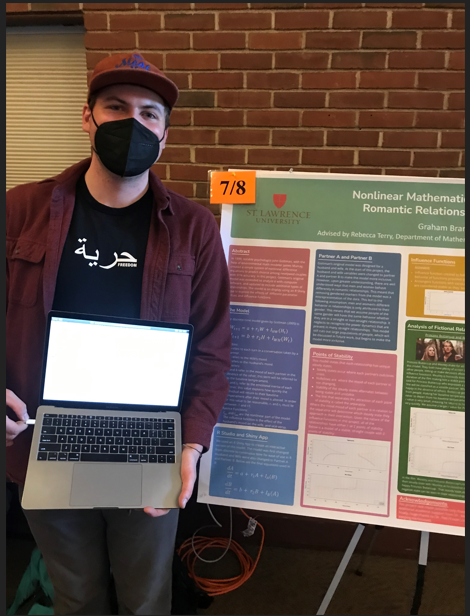
Graham Branch, Faculty Rebecca Terry, Mathematics
“Mathematical Modeling of Romantic Relationship Dynamics”
Abstract: In 1999, John Gottman first published research, wherewith the help of 2 simple differential equations, he was able to predict whether newlywed couples would get divorced with 91% accuracy. It can be hard to imagine that something that feels so human, can be described by math. Over the course of the semester, we took a deep dive into Gottman's research, recreating his original model. We used current gender research to make assumptions that allowed us to apply the model to more than just straight relationships. As well as used Shiny App to create an interactive version of the model to explore the outcomes of different kinds of relationships.
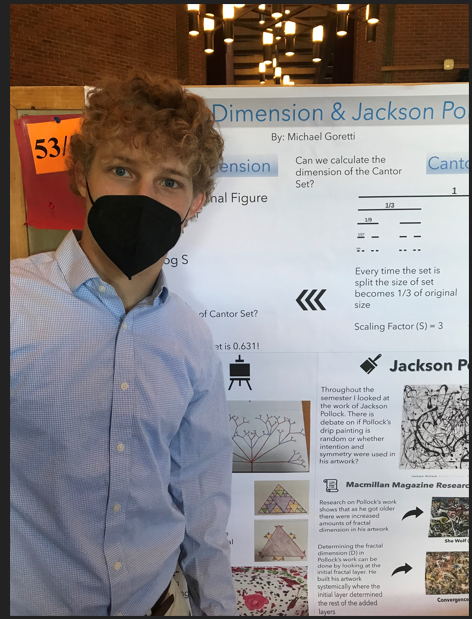
Michael Goretti, Faculty Maegan Bos, Mathematics
“Fractal Degree & Dimension”
Abstract: Throughout our everyday lives we see and interact with many different fractals and they play an important role in the world we live in. My research and presentation will look at the different types of fractals from basic self-similar forms to the more complex work of famous artist Jackson Pollock. I will be facilitating a discussion on how an artist or scholar is supposed to determine whether a piece of artwork is considered a fractal? Specifically, I will be presenting the “box-counting method,” in which artwork is covered with computer generator squares of varying sizes; degree of fractal dimension is calculated using an equation that links the number of squares to the size of these squares. I will also look at how natural patterns have a degree between 1.25 and 1.3 and apply this number to Pollock’s work and my own. In conclusion, I’m going to introduce a formula that can calculate the dimension of self-similar or fractal artwork. Looking at n = number of pieces in the final figure, s = scaling factor, d = dimension, and the formulas n = s ^ (d) and d = log n/log s.
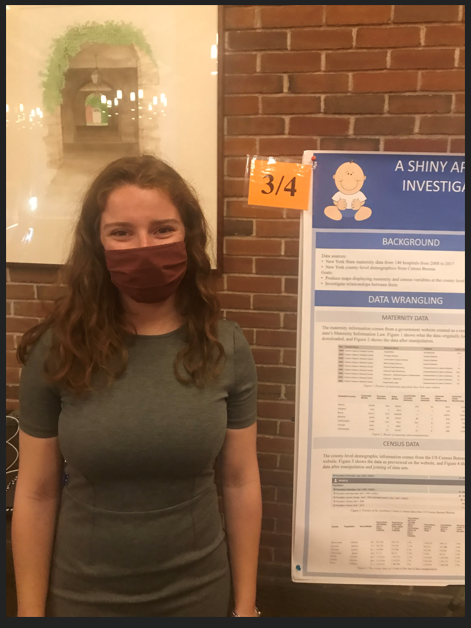
Maddox Ormiston, Faculty Robin Lock, Statistics
“A Shiny App to Map NY County-Level Maternity Data and Investigate Relationships with Census Demographics”
Abstract: New York State collected maternity data from 146 hospitals from 2008 to 2017. We produce a shiny app to display information from these data geographically at the county level. Women may face inequality in maternity care due to various demographics such as race and economic status. To help investigate possible differences, we create spatial visualizations and graphical analyses to connect the maternity data to information from the United States Census Bureau. This app can be found at https://stlawu.shinyapps.io/MaternityMap/
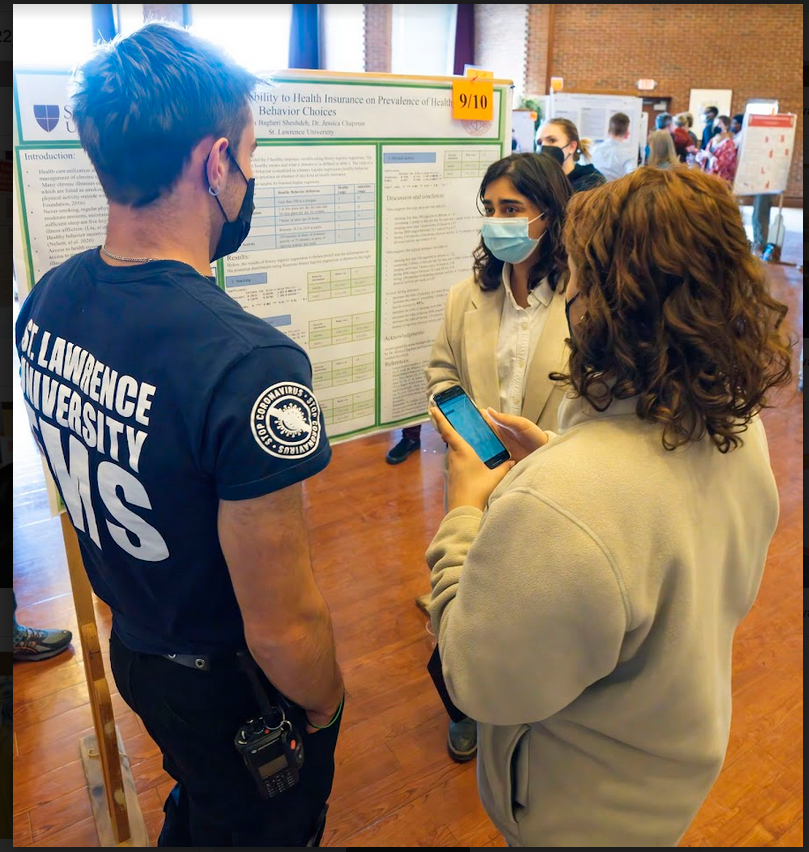
Aseman Bagheri Sheshdeh, Faculty Jessica Chapman, Statistics
“Analyzing the Effect of Accessibility to Health Insurance on Prevalence of Healthy Behavior Choices”
Abstract: Health care expenditure for chronic illness management accounts for 71% of total health care usage in the United States. Unhealthy behaviors have been shown to directly contribute to the emergence of chronic illness. Additionally, incentives for healthy behaviors have shown to promote the number of insured individuals, while termination of affordable health care such as Medicaid has shown to contribute to overall health deterioration. The interest in this study is on whether having health insurance would promote the prevalence of healthy behavior. The outcomes most definitive in determining healthy behavior surround five factors being, levels of alcohol consumption, levels of smoking, levels of sleeping, BMI, and levels of physical activity. We assess the relationship between having these healthy behaviors and having health insurance using Bayesian binomial logistic regression.
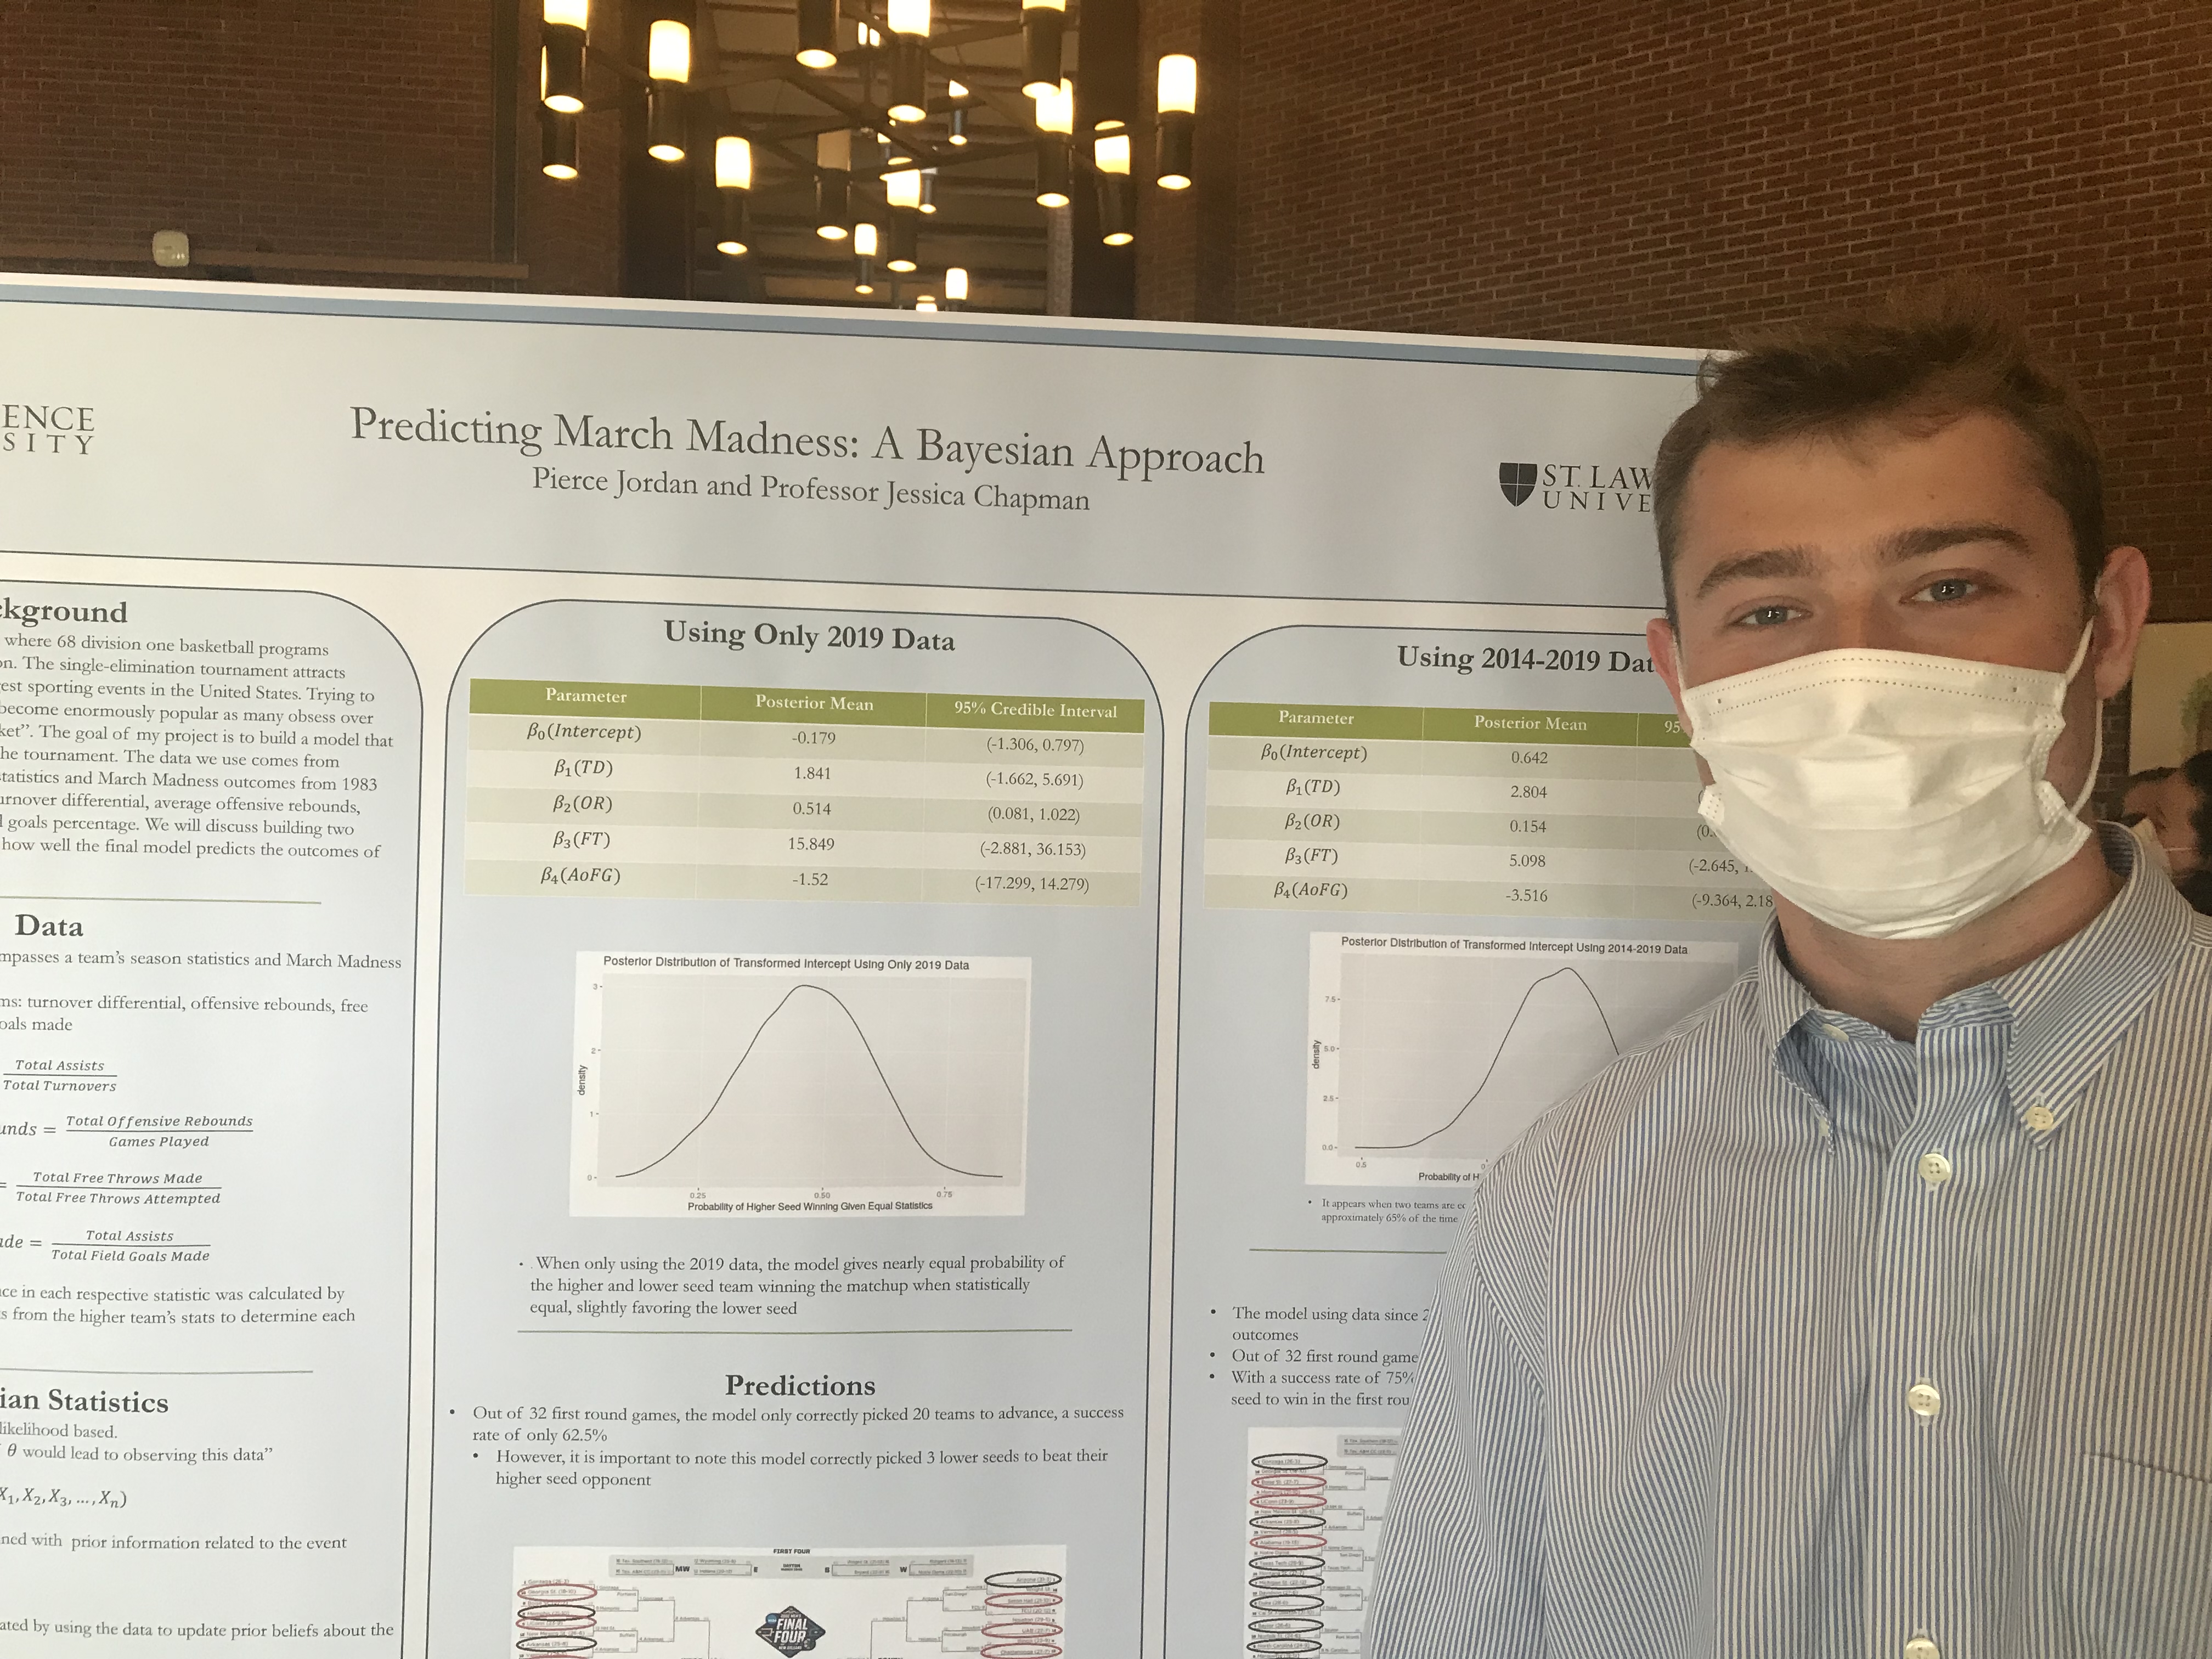
Pierce Jordan, Faculty Jessica Chapman, Statistics
“Predicting March Madness: A Bayesian Approach”
Abstract: March Madness is an annual competition where 68 division one basketball programs compete to become the national champion. The single-elimination tournament attracts millions of viewers and is one of the largest sporting events in the United States. Trying to predict the outcomes of every game has become enormously popular as many obsess over the thought of predicting a “perfect bracket”. The goal of my project is to build a model that can predict the first-round outcomes of the tournament. The data we use comes from Kaggle and encompasses regular season statistics and March Madness outcomes from 1983 to the present. The variables we use are turnover differential, average offensive rebounds, free throw percentage, and assists on field goals percentage. We will discuss building two Bayesian models, how they compare, and how well the final model predicts the outcomes of this year’s tournament.
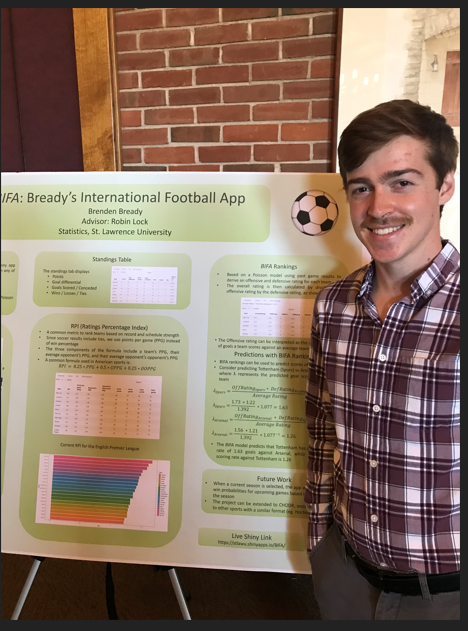
Brenden Bready, Faculty Robin Lock, Statistics
“BIFA, Bready’s International Football App”
Abstract: Bready’s International Football App, or BIFA, is an R shiny app designed to download current and past match results from any of Europe’s top 25 leagues. In addition to individual match results, BIFA provides up-to-date standings tables, RPI-based rankings, and offensive and defensive rankings based on a Poisson probability model. Using the model, BIFA generates win/loss/tie probabilities for past and future matches.
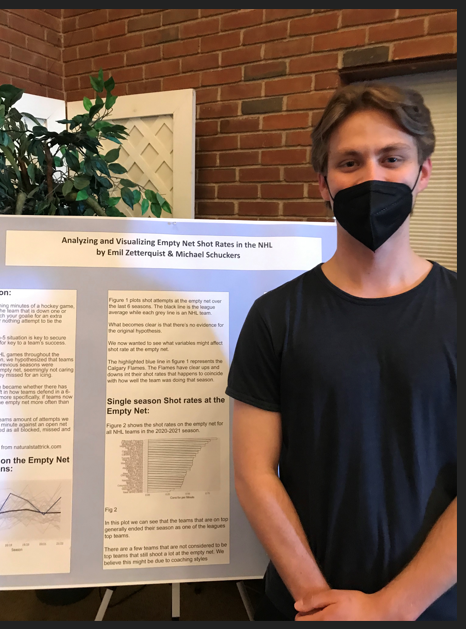
Emil Zetterquist, Faculty Michael Schuckers, Statistics
“A look into Empty Net shot rates in NHL”
Abstract: After watching NHL games throughout the 2021-2022 season, we hypothesized that teams more often than previous seasons were shooting for the empty net, seemingly not caring whether or not they missed for an icing. The question then became whether there has been a recent shift in how teams defend in a 6-on-5 situation. Looking at both team and league averages and how they changed throughout the years there was no significant overall difference in the last 5 years. The one main thing that was very visible was that teams that do good a particular year generally have a more attempts at the open net than those teams who do worse. This is most likely do to the fact that they spend time being up a goal or two at the end of the 3rd period. What is interesting is that there are a few teams that don't follow this general trend and there are teams who have a big shift in shot attempts at the open net from one particular year to the following. We think that coaching style may play a big part in this.
Although there was no significant result from this study, the results leads to more questions. A follow-up study might include a comparison between a more conservative vs aggressive approach to shooting at the open net and the teams' relative success. How to most effectively defend an empty net is something teams and coaches has been trying to figure since the first team pulled their goalie. From my own hockey experience, we have found that the most common way to defend has been to kill time by running out the clock, meaning that the defending team tries to get the puck out of their zone while simultaneously trying to not draw icing calls
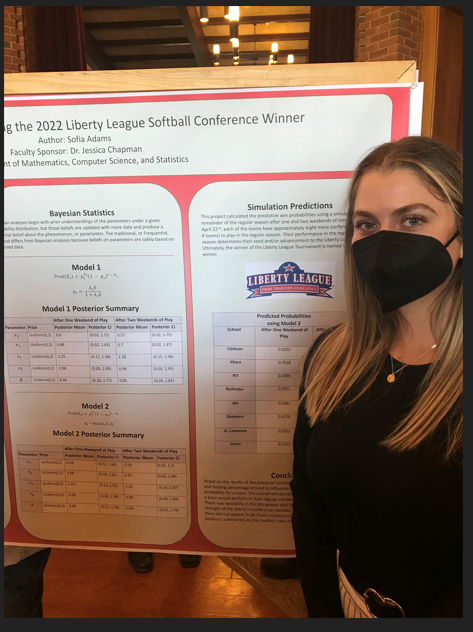
Sofia Adams, Faculty Jessica Chapman, Statistics
“Here We Go Saints! Predicting the 2022 Softball Conference Winner”
Abstract: The St. Lawrence University softball team is one of eight teams competing for the 2022 Liberty League conference title. Who will win the conference title? Historically, the title has been earned by Ithaca or Rochester, but pre-season data indicates that this could change. With multiple changes in head coaches for several teams, the addition of strong underclassmen, and the first “normal” season to be played since the pandemic, this season’s title could belong to anyone. Previous authors have used two-stage Bayesian models for predicting major league baseball outcomes, and this project will show how this could work for college softball. The predictors that will be used in this project are: team’s winning percentage, team ERA (earned run average), team batting average, and team fielding percentage, while allowing for the possibility of a home field advantage. The goal of this project is to use a similar Bayesian two-stage model to predict the Liberty League outcomes after one and two weekends of league play.
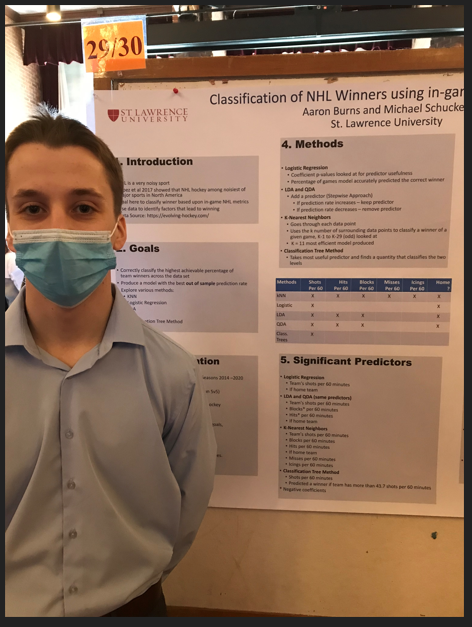
Aaron Burns, Faculty Michael Schuckers, Statistics
“Classification of NHL Winners Using in-game 5v5 Close Data”
Abstract: In this project, we analyze National Hockey League (NHL) event rate data in an attempt to classify teams into winners and losers. The goal is to produce efficient out-of-sample predictions for game winners. The data set was all NHL games from the 2015 -2020 regular seasons, and included all NHL recorded event data each game. In order to minimize the effects of game state, the data set was filtered to instances of even strength and where the goal differential was “close”, less than or equal to 1. All data was rate standardized to be the number of events per minute of even strength close time. We explored and compared the following classification methods Linear Discriminant Analysis, Quadratic Discriminant Analysis, K-Nearest Neighbors, Logistic Regression, and Classification Tree Method. The most efficient model achieved for this prediction rate was the KNN model, with an out-of-sample prediction rate of 62.50%. Non-surprisingly, the least efficient model was the Logistic Regression model with successful predictions about 50% of the time. Using a season based chronological split for our training and testing data saw an increase in the performance of the Logistic approach but none of the other methods saw major changes. With these results, we conclude that to most efficiently predict whether an event team won the game, the best model/method to use is that of K-Nearest Neighbors.
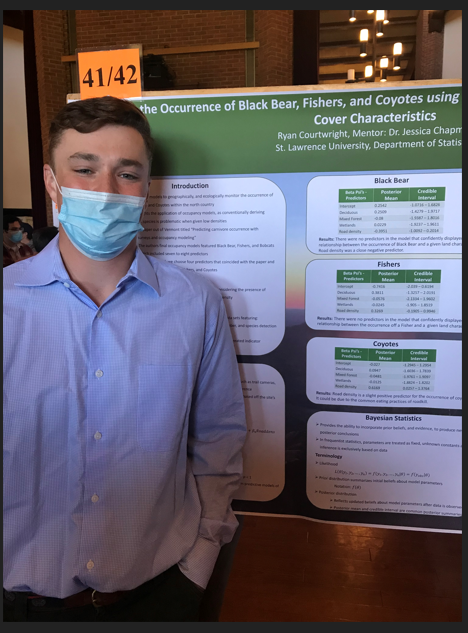
Ryan Courtwright, Faculty Jessica Chapman, Statistics
“Analyzing the Occurrence of Black Bear using Occupancy Models given Various Land Cover, Human Footprint, and Predator-Prey Characteristics”
Abstract: Analyzing the movement and tendencies of rare animals can be difficult, especially when such fascinating beings have sequestered themselves into the remote plains, and forests just north of the Adirondack Park. Trail Camera data, collected from the biology department at St. Lawrence University between 2018 and 2020, features thousands of photographs from over a hundred site locations, and has the potential to unlock the mysteries that live alongside us. Trail camera photos of a species, such as Black Bear, clearly provide evidence that the species has been seen in a specific location, but the lack of photographic evidence does not necessarily mean the species doesn’t use that space. Occupancy models take this into account. We used occupancy models to geographically and ecologically monitor the occurrence of Black Bear within the North Country. This study highlights the application of occupancy models while considering land cover characteristics, the presence of prey and predators, and a factor representing human-footprint.
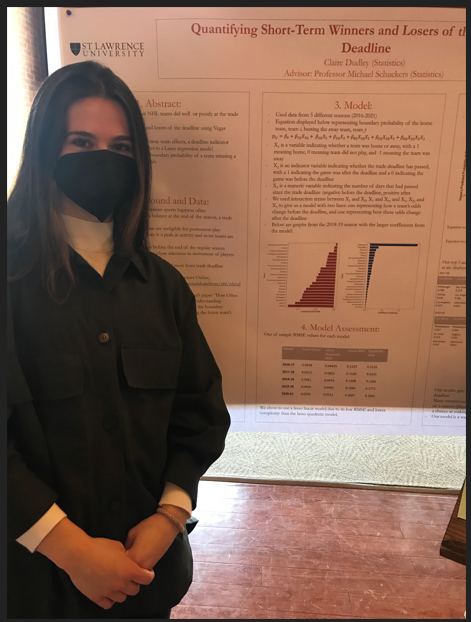
Claire Dudley, Faculty Michael Schuckers, Statistics
“Quantifying Short-Term Winners and Losers of the NHL Trade Deadline”
Abstract: In the NHL, a common conversation topic is discussing which teams did “well” and which teams did “poorly” at the trade deadline, which is the point in time after which teams cannot make player exchanges. Any player traded after the deadline is not eligible to play on a team’s playoff roster. In this study, we were looking to assess the short-term “winners” and “losers” of the trade deadline by looking at Vegas’s moneyline odds and how they change at the deadline. The data used in this study was from Sports Books Reviews Online, and we used data from each season from 2016-2021 that included the date of a game, one of the teams playing, the number of goals said team scored each period and the total number of goals, opening and closing money lines, and puck lines. We used two different models, one using simple linear regression and one using Lasso regression, including the variables days relative to the trade deadline, a home team effect, a deadline indicator variable, and interaction variables between the home team effect and the other two variables as well as an interaction effect of the deadline indicator on both the days relative to the trade deadline and the home team effect. The response variable was the Boundary Probability which we calculated from the moneyline odds in the Sports Books dataset. We found that the model with the lowest MSE values was the lasso model with two linear lines, one for before the deadline and one for after, and so we used this model to evaluate the winners and losers of the trade deadline from 2016-2021.
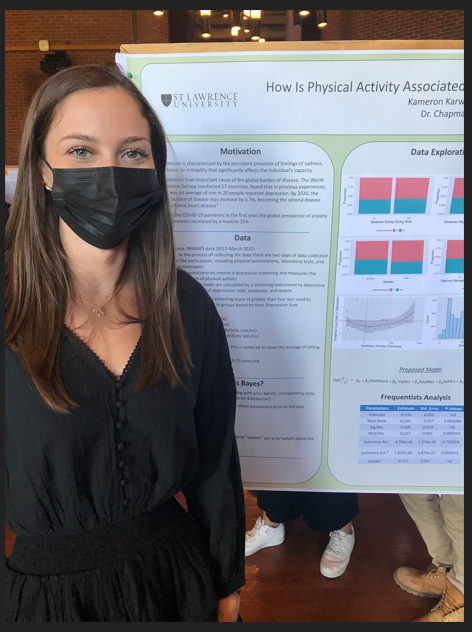
Kameron Karwowski, Faculty Jessica Chapman, Statistics
“How is Physical Activity Associated with Depression Symptoms?”
Abstract: Depression is characterized by the persistent presence of feelings of sadness, emptiness, or irritability that significantly affects the individual’s capacity. It is commonly believed that physical activity reduces rates of depression, and we investigate this claim in this project. This research was conducted by using the NHANES data from 2017-March 2020. The National Health and Nutrition Examination Survey (NHANES), conducted by the National Center for Health Statistics (NCHS), typically examines about 5,000 individuals per year. In this process there are two days of data collection for the participants, including physical examinations, laboratory tests, and questionnaires. The questionnaire data includes a depression screening and measures of the involvement in physical activity. For this project, we are going to consider a Bayesian logistic regression model to discover how engaging in recreational activities reduce depression based on gender.
Edward Towers, Faculty Jessica Chapman, Statistics
“Applying Bayesian Logistic Regression to Learning Disabilities in the United States”
Abstract: According to the National Center for learning disabilities, 1 in every 5 children in the United States has a learning disability. Using data from the National Survey of Children’s Health, we aim to use both pre-birth and experiential variables to create and compare Bayesian Logistic Models to best predict the probability of a child in the United States being diagnosed with a learning disability.