Outcomes: Continued Education 2013
22%
Class of 2012 enrolled in further study 7-10 months out
From the Career Services Follow-Up Survey, Class of 2012
50%
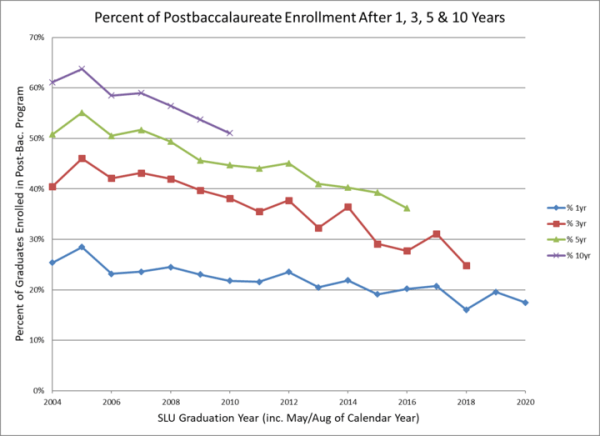
Attend grad school within 5 years
Classes of 2004-2008; From National Student Clearinghouse + Advancement office data
23%
Earn a graduate degree within 5 years
Classes of 2004-2008
Top Graduate Schools Enrolled At Within 5 years
Based on National Student Clearinghouse and Career Services data for class years from 2004-2008 for any enrollment within 5 years of graduation.
- St Lawrence University
- University at Buffalo
- SUNY College at Potsdam
- Syracuse University
- University of Vermont
- Northeastern University
- SUNY at Albany
- Boston University
- Harvard University
- Clarkson University
Top Graduate Schools Enrolled At Within 10 years
Based on National Student Clearinghouse and Career Services data for class years from 2000-2003 for any enrollment within 10 years of graduation.
- St Lawrence University
- SUNY-Potsdam
- SUNY at Albany
- Harvard University
- Syracuse University
- SUNY at Buffalo
- University of Southern Maine
- Clarkson University
- Lesley University
- University of Vermont
By Division
Percentages of students who majored in the sciences, social sciences, humanities, and area/interdisciplinary studies in the classes of 2004-2008 who enroll in graduate or professional school within 5 years after graduating. Students with double majors in different divisions are counted once for each unique division they majored in. Data are from the National Student Clearinghouse.
- Arts: 41%
- Humanities: 49%
- Social Sciences: 45%
- Sciences: 61%
- Interdisciplinary: 43%
Graduate/Professional School Programs
Below is a breakdown of the number of students who attended graduate school within 7-9 months of graduating from St. Lawrence.
| Graduate Program Type | Number Attending | % of Attending |
|---|---|---|
| Education | 20 | 19.2% |
| Science & Technology | 20 | 19.2% |
| Health-Related | 14 | 13.5% |
| Social Sciences | 13 | 12.5% |
| Law | 10 | 9.6% |
| Business | 8 | 7.7% |
| Medicine | 7 | 6.7% |
| Arts &Humanities | 4 | 3.8% |
| Other Graduate Programs | 4 | 3.8% |
| Not Indicated | 4 | 3.8% |
| Total Graduate/Professional School | 104 | 100% |
*Graduate and Professional School only, does not include other post baccalaureate education. Data courtesy of Career Services New: Outcomes Profiles covering a 5-year aggregate for each academic division are now available.