Student Diversity 2022
211
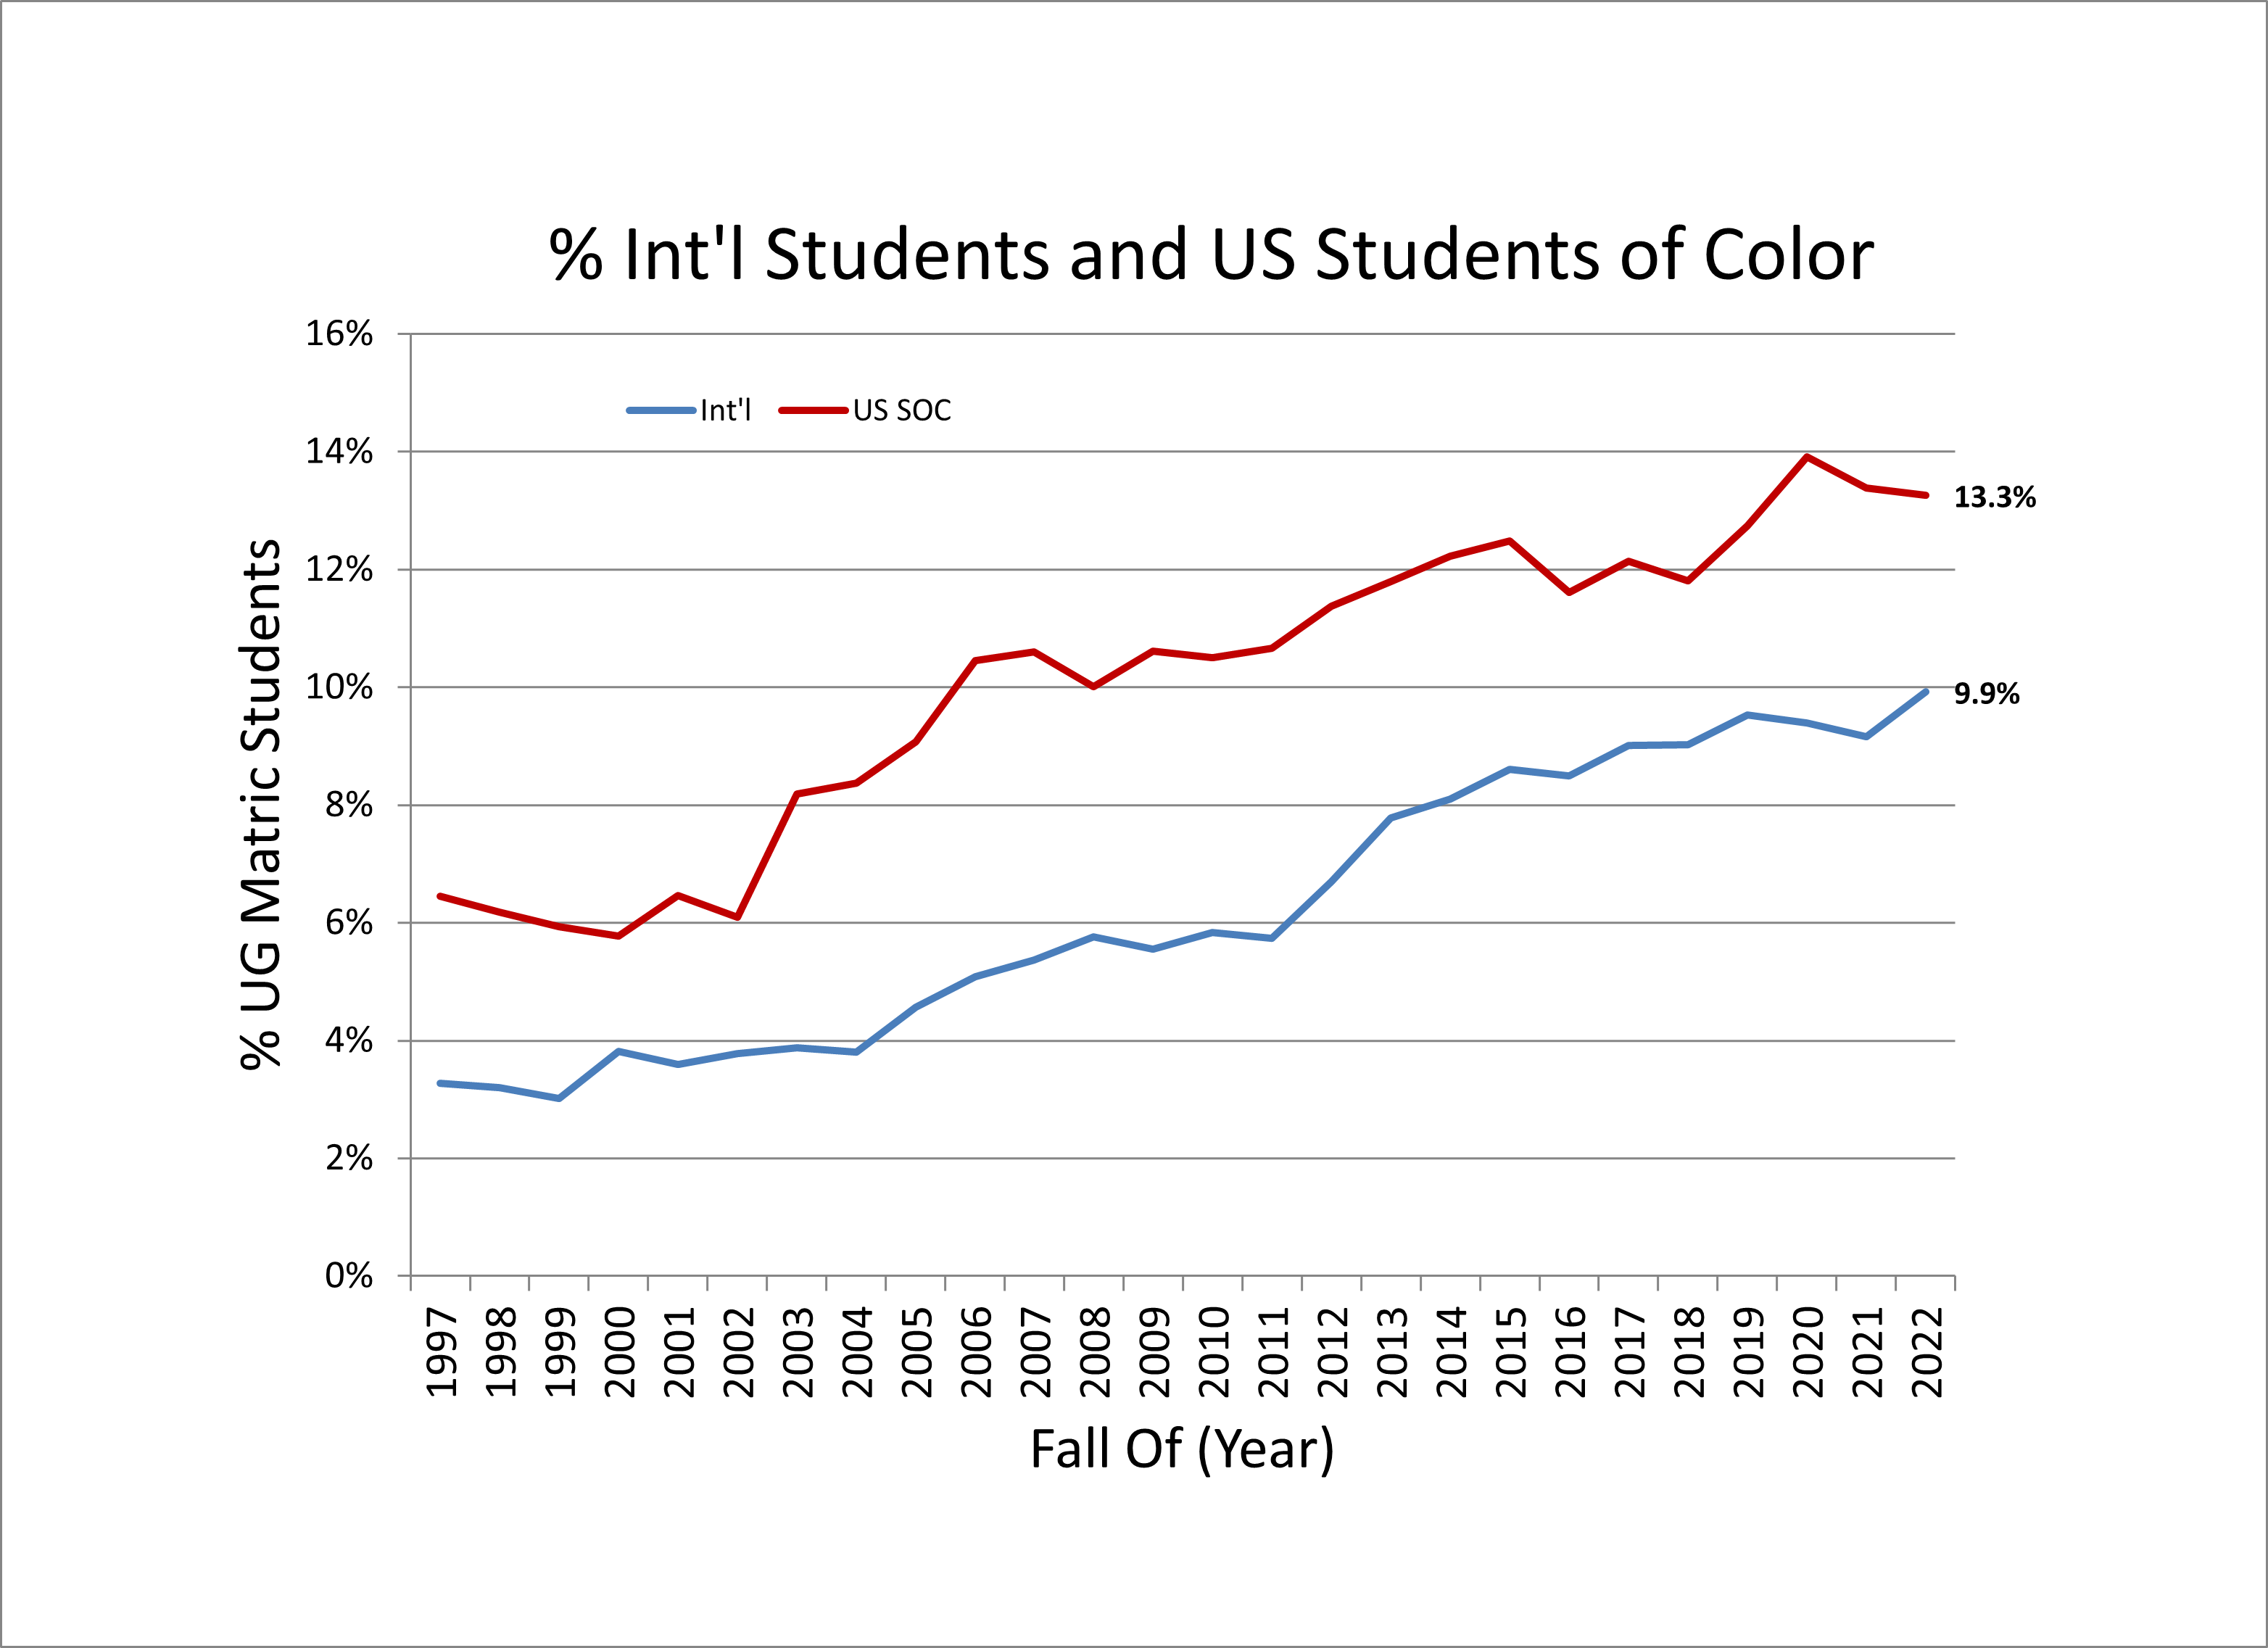
International Students
9.9%
International Students
13.3%
US Students of Color
Statistics as of Fall 2022.
- Male: 45.8%
- Female: 54.2%
| Race/Ethnicity | Headcount | Percent |
|---|---|---|
| US Hispanic/Latino | 130 | 6.1% |
| US Black | 56 | 2.6% |
| US Asian | 43 | 2.0% |
| US Native American/American Indian | 7 | 0.3% |
| US Nat Hawaiian/Pacific Islander | 1 | 0.0% |
| US Multiracial/Other Minority | 45 | 2.1% |
| Subtotal, US Students of Color | 282 | 13.3% |
| US White | 1,612 | 75.8% |
| US, Unknown | 22 | 1.0% |
| Non-Resident Alien | 211 | 9.9% |
| Total, Undergrad Degree-Seeking | 2,127 | 100.0% |
Socio-Economic Diversity
Pell Grant Recipients: 19.8%
International Students
Top Nations Represented
- Canada [47]
- China [13]
- Kenya [10]
- Tanzania [8]
- India [6], Mexico [6]
- United Kingdom [4], Italy [4], Albania [4]