World Languages Week 2025
Celebrate World Languages Week with a series of great events, including SLU Iron Chef Competition, Kaleidoscope, HennaFest, Karaoke, and World Trivia nights—to name a few!
- -
Celebrate World Languages Week with a series of great events, including SLU Iron Chef Competition, Kaleidoscope, HennaFest, Karaoke, and World Trivia nights—to name a few!
As a new employee at St. Lawrence University there are tasks you need to complete, and information you may need. This page provides much of that information. Please contact Human...
Students will receive their Campus ID Card when they arrive on campus for Orientation. Please see the photo submission information and the photo request form on your application status page...
Physics in Perspective Phys. perspect. 1 (1999) 215-218 1422-6944/99/020215-04 $ 1.50 + 0.20/0 ©Birkhauser Verlag, Basel, 1999. Article reproduced with permission. Alfred Romer, Emeritus Professor of Physics at St. Lawrence...
Overview Class of 2024, your St. Lawrence student accounts will expire on May 31, 2025. Class of 2023, your St. Lawrence student accounts will expire on May 31, 2024. Graduating...
From the Career Services Follow-Up Survey, Class of 2021
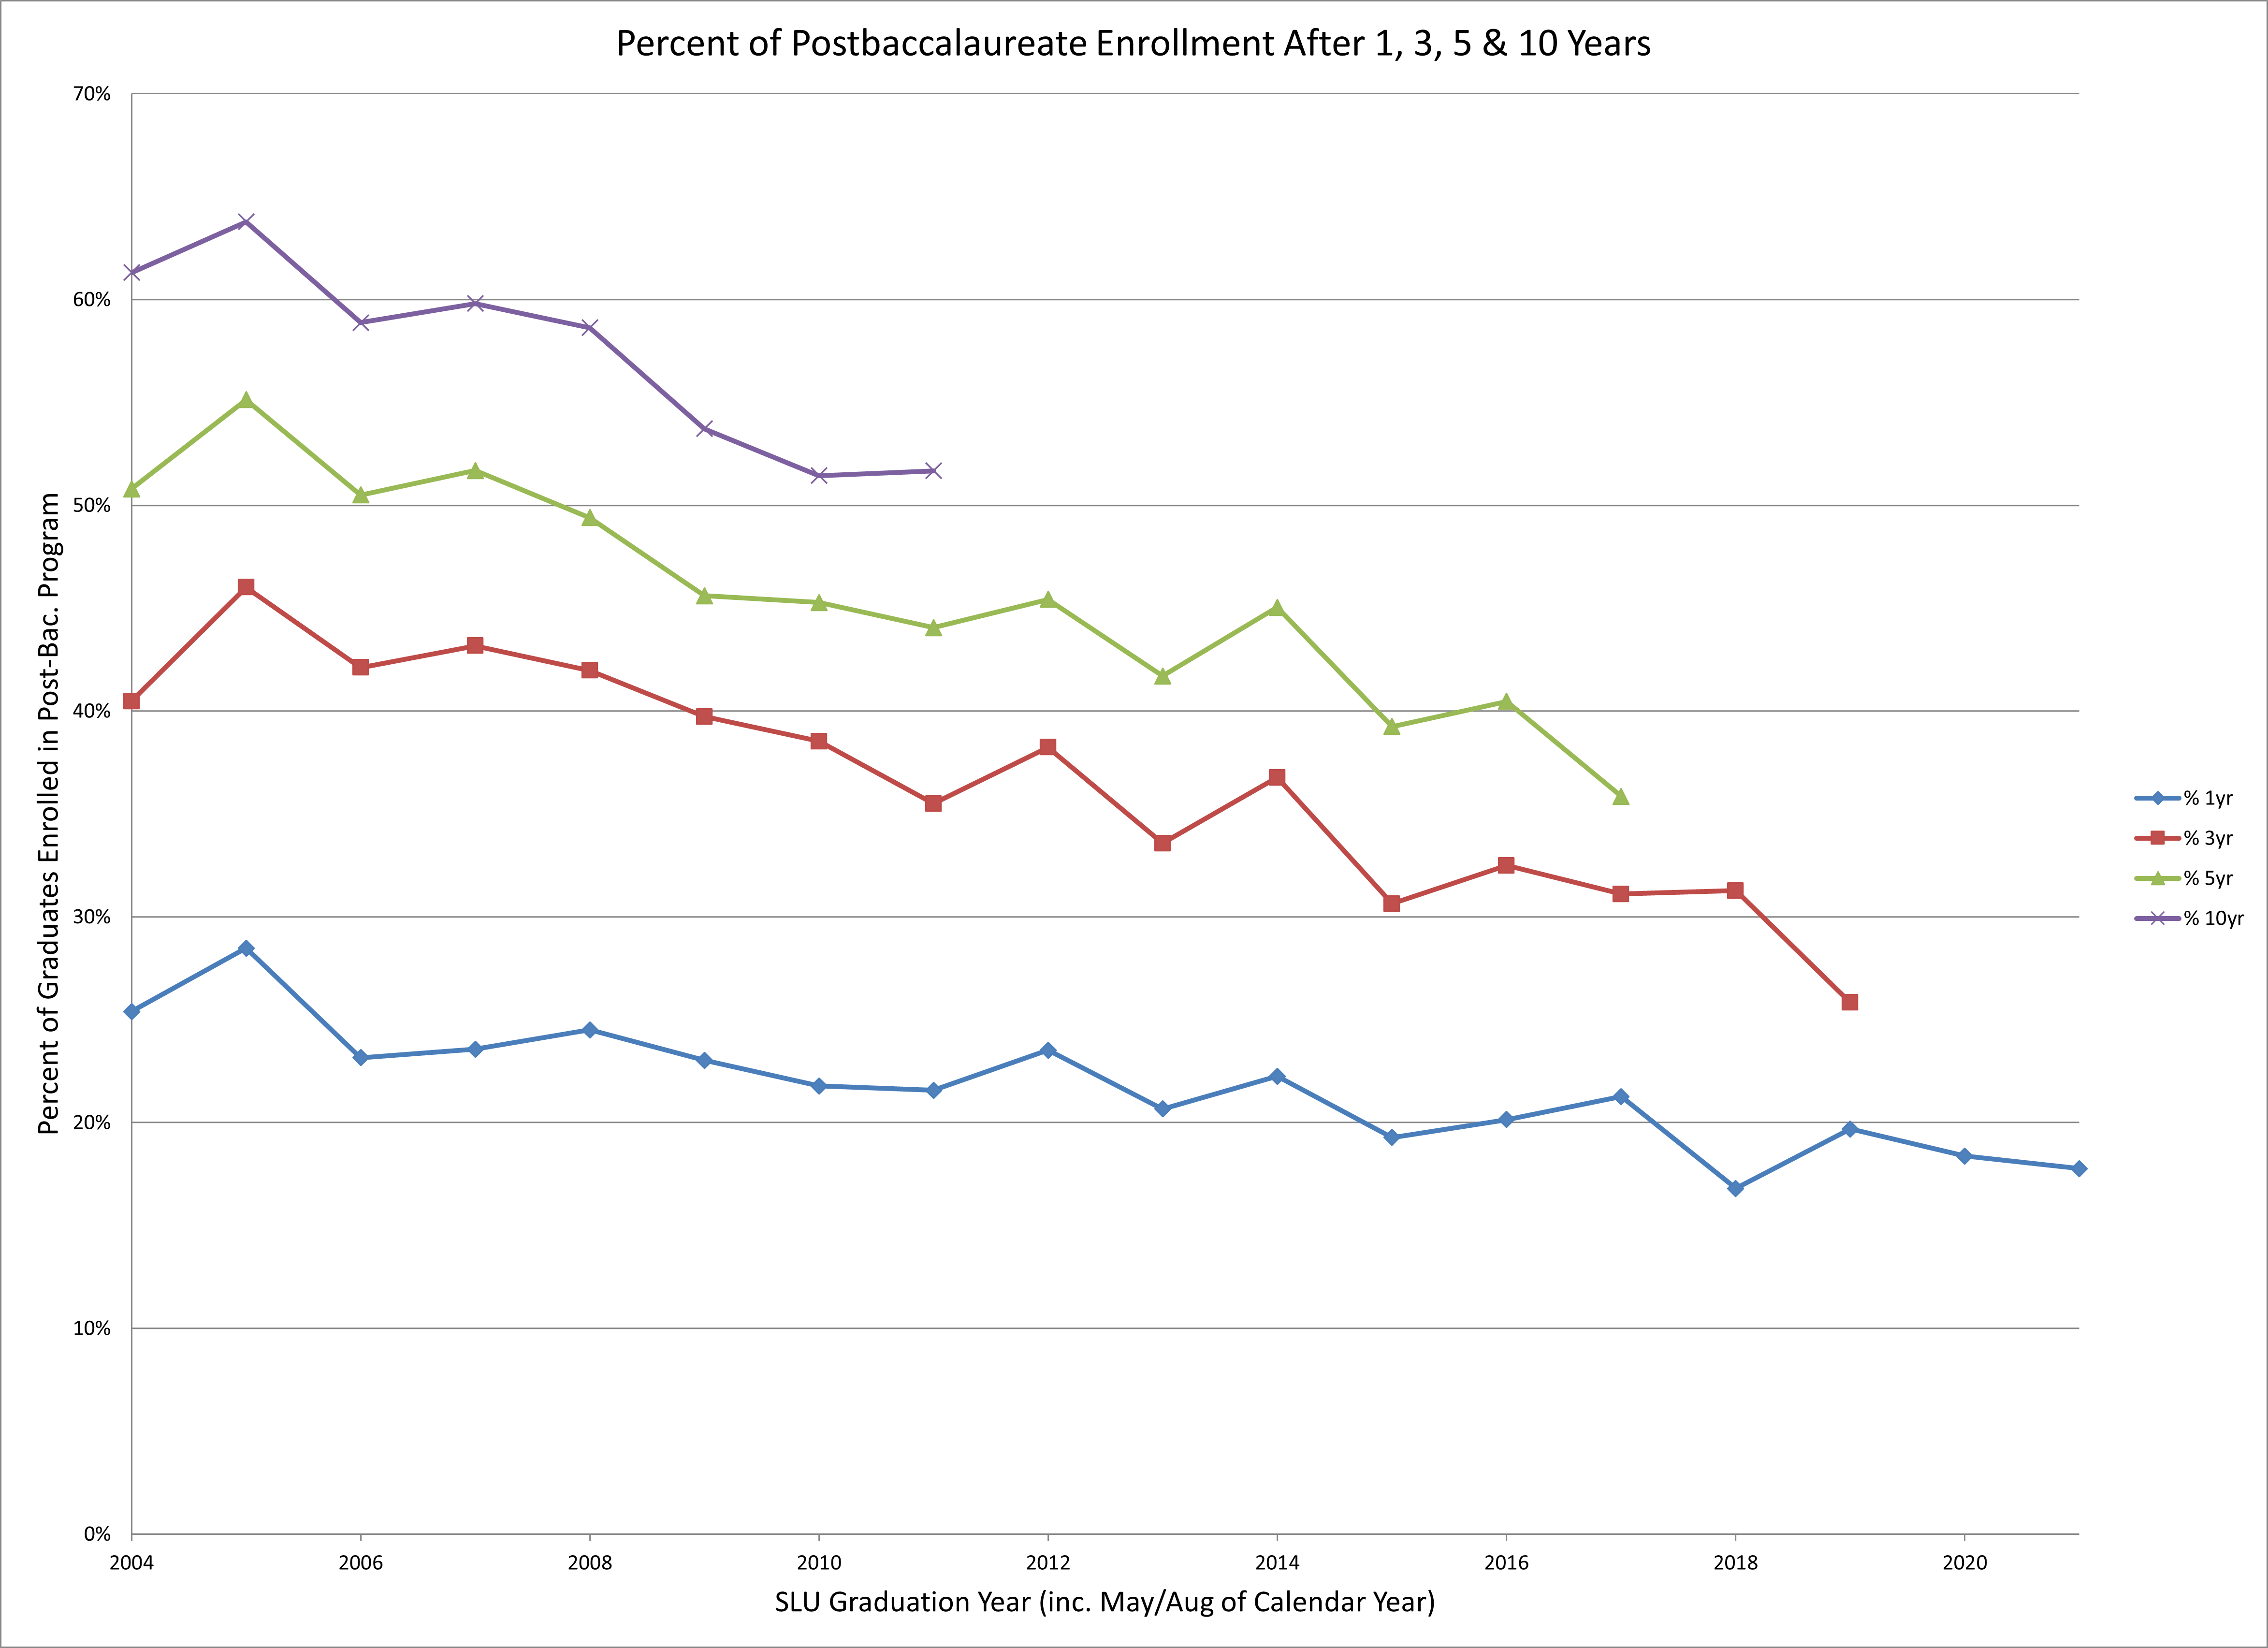
Classes of 2013-2017; From National Student Clearinghouse + Advancement office data
Classes of 2013-2017
Lists the first school a student enrolled at after graduating from St. Lawrence. Based on National Student Clearinghouse and Career Services data for class years of 2013-2017.
If a student attended more than one school after graduating from St. Lawrence, each school gets counted once. Based on National Student Clearinghouse data for class years of 2008-2012.
Percentage of students who majored in the arts, humanities, sciences, social sciences, or interdisciplinary areas of study for the classes of 2013-2017 that enrolled in a college/university or professional school within 5 years of graduating from St. Lawrence. Double major students with majors in different divisions are counted once for each division. Data are from the National Student Clearinghouse and Career Services Survey.
Outcomes Profiles covering a 5-year aggregate for each division/department are available.
Number of Class of 2021 graduates who continued education within 7-9 months after graduating from St. Lawrence. Data is from the Career Services Survey.
| Graduate Program Type | Number Attending | % Attending |
|---|---|---|
| Science & Technology | 10 | 12.8% |
| Social Sciences | 10 | 12.8% |
| Arts & Humanities | 7 | 9.0% |
| Medicine | 10 | 12.8% |
| Business | 14 | 18.0% |
| Nursing/PA/NP | 4 | 5.1% |
| Other Postbacc. Programs | 4 | 5.1% |
| Education | 12 | 15.4% |
| Law | 7 | 9.0% |
| Total Graduate School | 78 | 100.0% |
From the Career Services Follow-Up Survey, Class of 2022
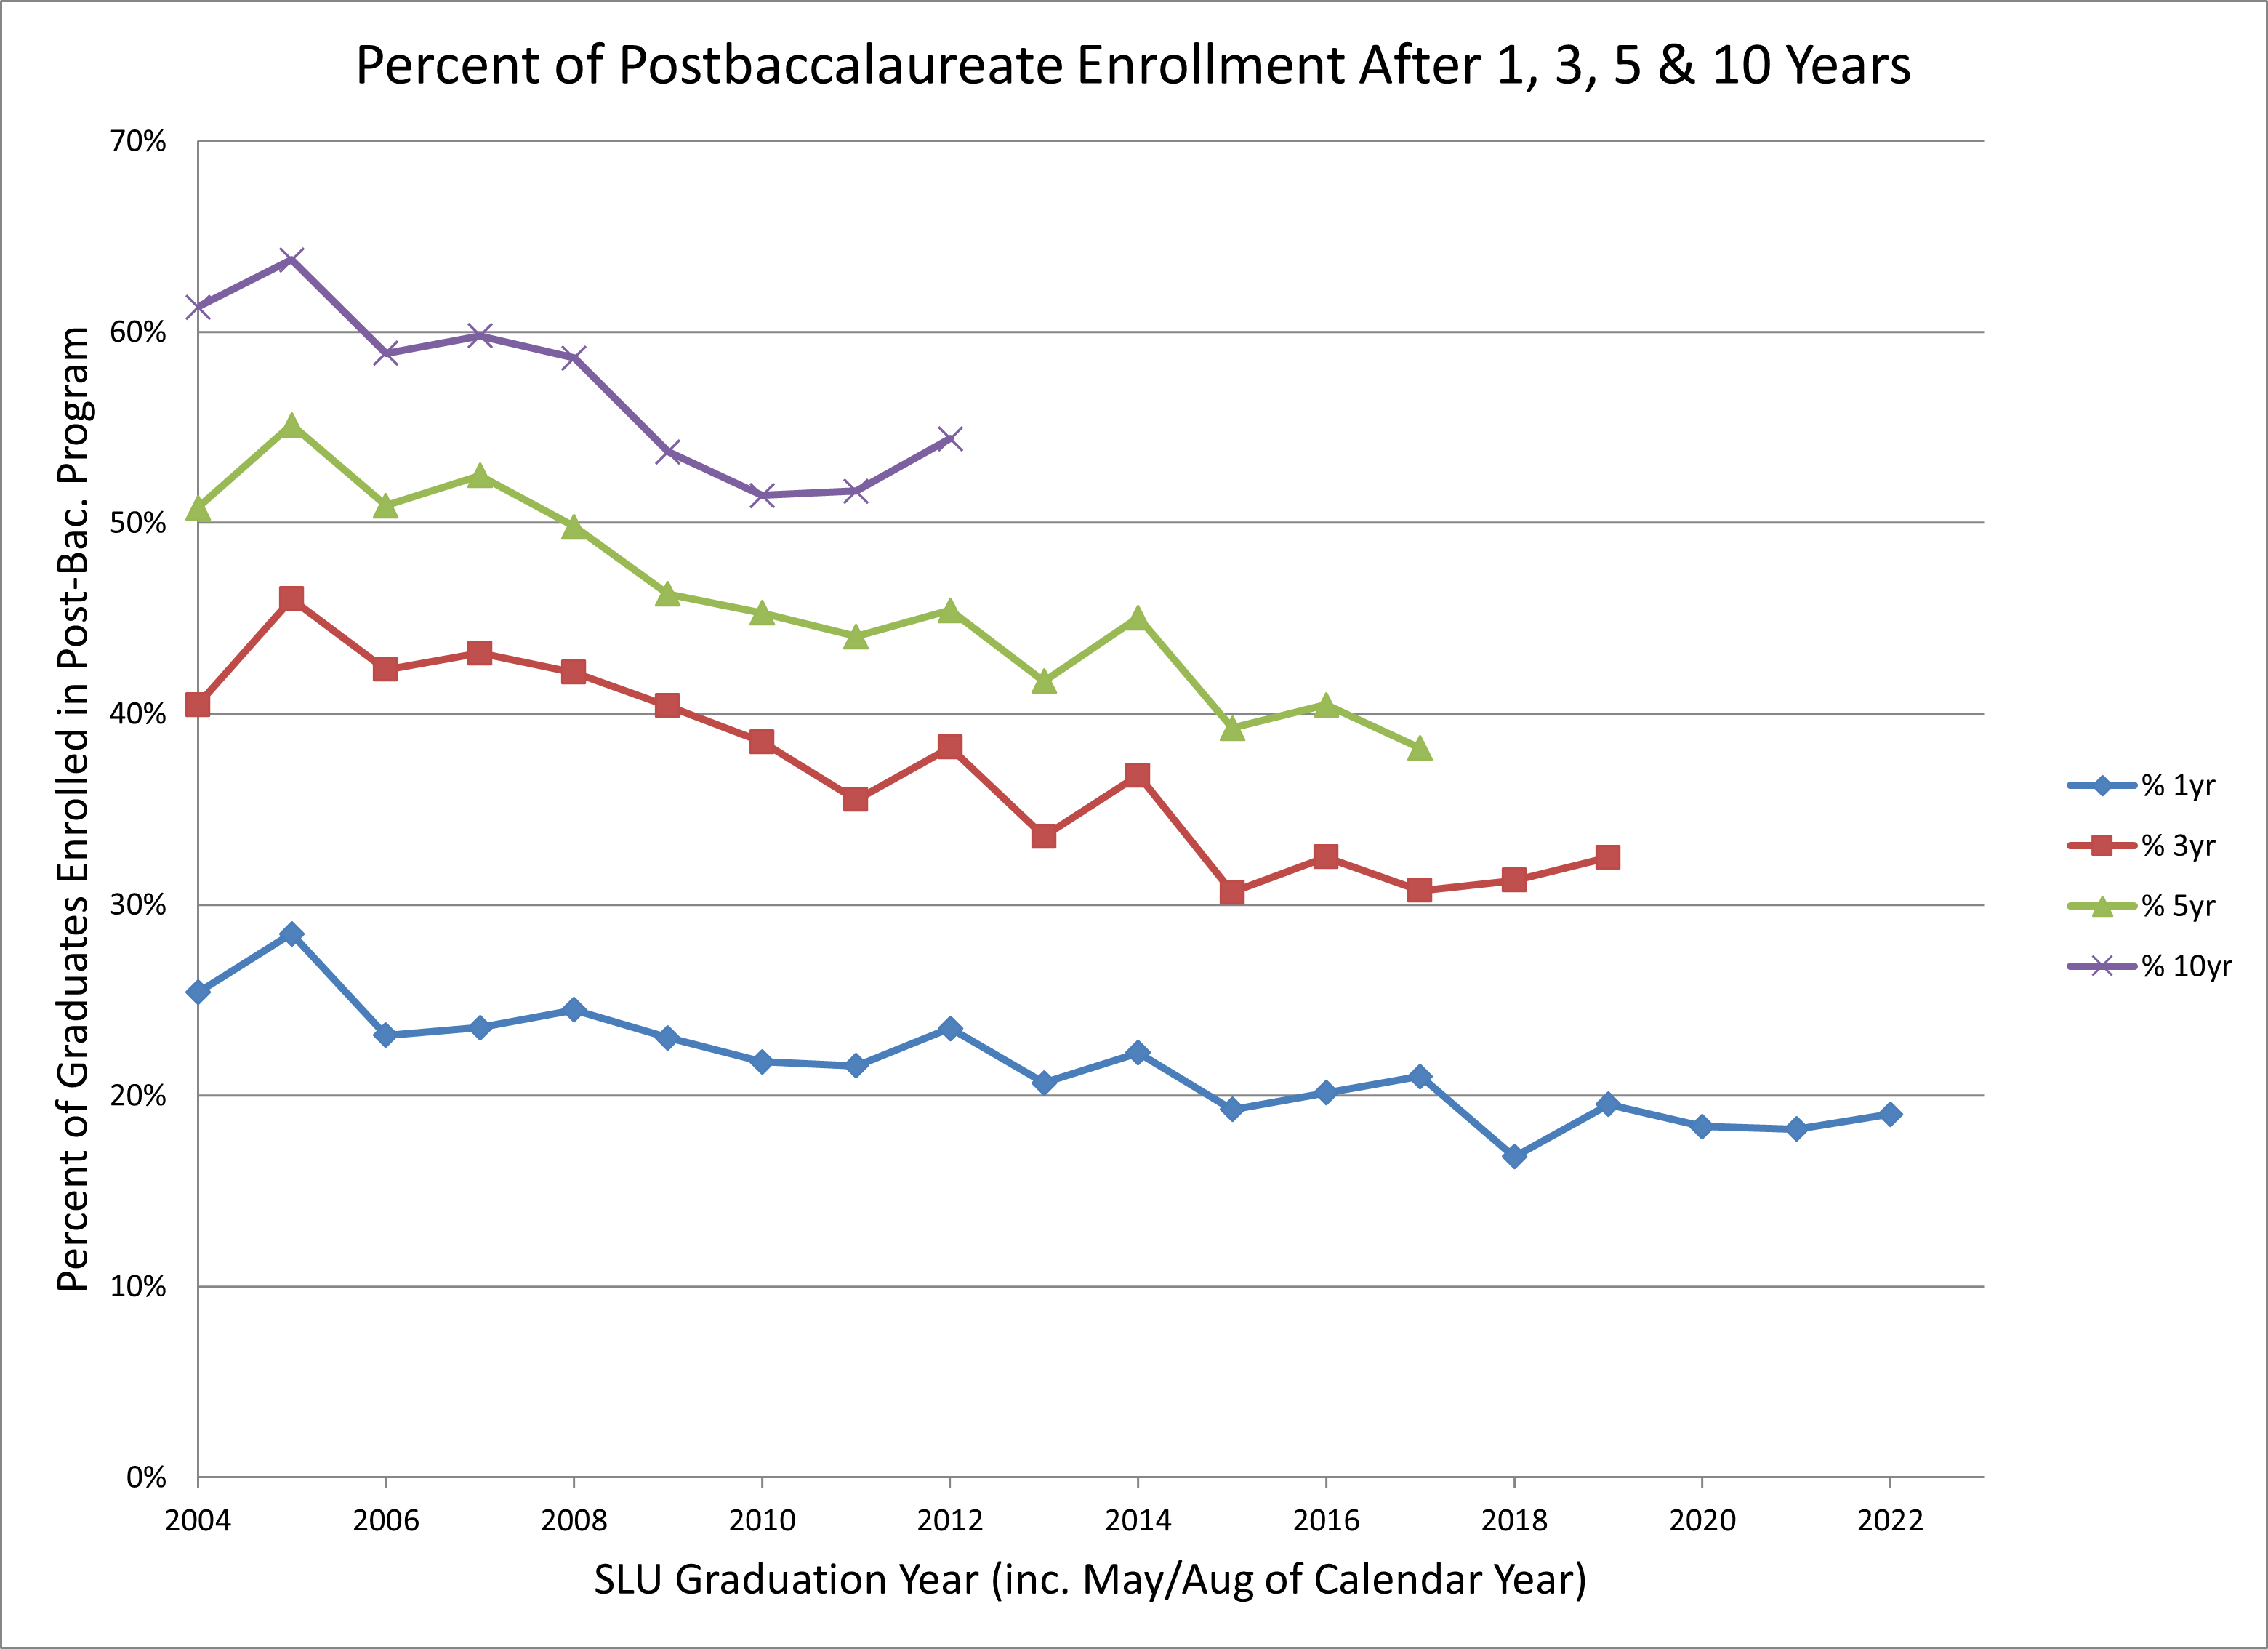
Classes of 2014-2018; From National Student Clearinghouse + Advancement office data
Classes of 2014-2018
Lists the first school a student enrolled at after graduating from St. Lawrence. Based on National Student Clearinghouse and Career Services data for class years of 2014-2018.
If a student attended more than one school after graduating from St. Lawrence, each school gets counted once. Based on National Student Clearinghouse data for class years of 2008-2012.
Percentage of students who majored in the arts, humanities, sciences, social sciences, or interdisciplinary areas of study for the classes of 2014-2018 that enrolled in a college/university or professional school within 5 years of graduating from St. Lawrence. Double major students with majors in different divisions are counted once for each division. Data are from the National Student Clearinghouse and Career Services Survey.
Outcomes Profiles covering a 5-year aggregate for each division/department are available.
Number of Class of 2022 graduates who continued education within 7-9 months after graduating from St. Lawrence. Data is from the Career Services Survey.
| Graduate Program Type | Number Attending | % Attending |
|---|---|---|
| Science & Technology | 14 | 16.9% |
| Social Sciences | 14 | 16.9% |
| Arts & Humanities | 4 | 4.8% |
| Medicine | 3 | 3.6% |
| Business | 6 | 7.2% |
| Nursing/PA/NP | 6 | 7.2% |
| Other Postbacc. Programs | 10 | 12.0% |
| Education | 16 | 19.3% |
| Law | 3 | 3.6% |
| Total Graduate School | 83 | 100.0% |
From the Career Services Follow-Up Survey, Class of 2017
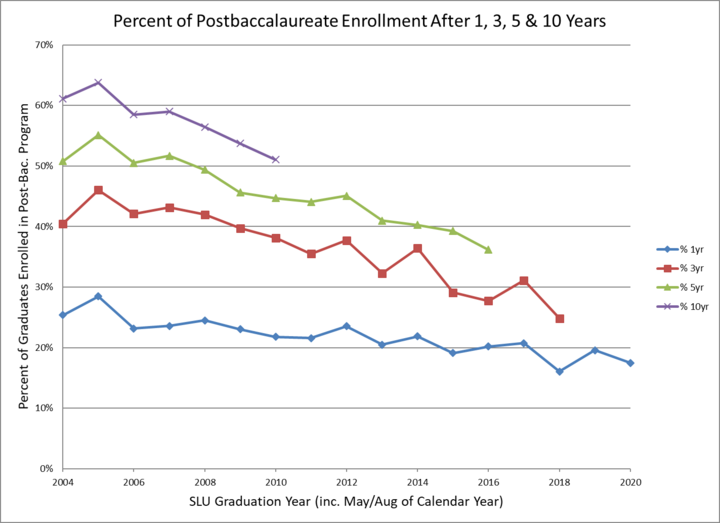
Classes of 2010-2014; From National Student Clearinghouse + Advancement office data
Classes of 2010-2014
Lists the first school a student enrolled at after graduating from St. Lawrence. Based on National Student Clearinghouse and Career Services data for class years of 2010-2014.
If a student attended more than one school after graduating from St. Lawrence, each school gets counted once. Based on National Student Clearinghouse data for class years of 2005-2009.
Percentage of students who majored in the arts, humanities, sciences, social sciences, or interdisciplinary areas of study for the classes of 2010-2014 that enrolled in a college/university or professional school within 5 years of graduating from St. Lawrence. Double major students with majors in different divisions are counted once for each division. Data are from the National Student Clearinghouse and Career Services Survey.
Outcomes Profiles covering a 5-year aggregate for each division/department are available.
Number of Class of 2018 graduates who continued education within 7-9 months after graduating from St. Lawrence. Data is from the Career Services Survey.
| Graduate Program Type | Number Attending | % Attending |
|---|---|---|
| Education | 16 | 23.5% |
| Science & Technology | 16 | 22.1% |
| Social Sciences | 14 | 20.6% |
| Other Postbacc Programs | 5 | 7.4% |
| Law | 4 | 5.9% |
| Medicine | 4 | 5.9% |
| Business | 3 | 4.4% |
| Arts & Humanities | 3 | 4.4% |
| Nursing/PA/NP | 3 | 4.4% |
| Total Graduate School | 68 | 98.5% |
From the Career Services Follow-Up Survey, Class of 2013
Classes of 2005-2009; From National Student Clearinghouse + Advancement office data
Classes of 2005-2009
Based on National Student Clearinghouse and Career Services data for class years from 2005-2009 for any enrollment within 5 years of graduation.
Based on National Student Clearinghouse and Career Services data for class years from 2000-2004 for any enrollment within 10 years of graduation.
Percentages of students who majored in the sciences, social sciences, humanities, and area/interdisciplinary studies in the classes of 2005-2009 who enroll in graduate or professional school within 5 years after graduating. Students with double majors in different divisions are counted once for each unique division they majored in. Data are from the National Student Clearinghouse.
Below is a breakdown of the number of students who attended graduate school within 7-9 months of graduating from St. Lawrence.
| Graduate Program Type | Number Attending | % Attending |
|---|---|---|
| Education | 22 | 25.6% |
| Science & Technology | 18 | 20.9% |
| Social Sciences | 9 | 10.5% |
| Medicine | 8 | 9.3% |
| Arts &Humanities | 8 | 9.3% |
| Business | 6 | 7.0% |
| Health-Related | 6 | 7.0% |
| Law | 4 | 4.7% |
| Other Graduate Programs | 3 | 3.5% |
| Not Indicated | 2 | 2.3% |
| Total Graduate School | 86 | 100.0% |
*Graduate and Professional School only, does not include other post baccalaureate education. Data courtesy of Career Services New: Outcomes Profiles covering a 5-year aggregate for each academic division are now available.
From the Career Services Follow-Up Survey, Class of 2012
Classes of 2004-2008; From National Student Clearinghouse + Advancement office data
Classes of 2004-2008
Based on National Student Clearinghouse and Career Services data for class years from 2004-2008 for any enrollment within 5 years of graduation.
Based on National Student Clearinghouse and Career Services data for class years from 2000-2003 for any enrollment within 10 years of graduation.
Percentages of students who majored in the sciences, social sciences, humanities, and area/interdisciplinary studies in the classes of 2004-2008 who enroll in graduate or professional school within 5 years after graduating. Students with double majors in different divisions are counted once for each unique division they majored in. Data are from the National Student Clearinghouse.
Below is a breakdown of the number of students who attended graduate school within 7-9 months of graduating from St. Lawrence.
| Graduate Program Type | Number Attending | % of Attending |
|---|---|---|
| Education | 20 | 19.2% |
| Science & Technology | 20 | 19.2% |
| Health-Related | 14 | 13.5% |
| Social Sciences | 13 | 12.5% |
| Law | 10 | 9.6% |
| Business | 8 | 7.7% |
| Medicine | 7 | 6.7% |
| Arts &Humanities | 4 | 3.8% |
| Other Graduate Programs | 4 | 3.8% |
| Not Indicated | 4 | 3.8% |
| Total Graduate/Professional School | 104 | 100% |
*Graduate and Professional School only, does not include other post baccalaureate education. Data courtesy of Career Services New: Outcomes Profiles covering a 5-year aggregate for each academic division are now available.