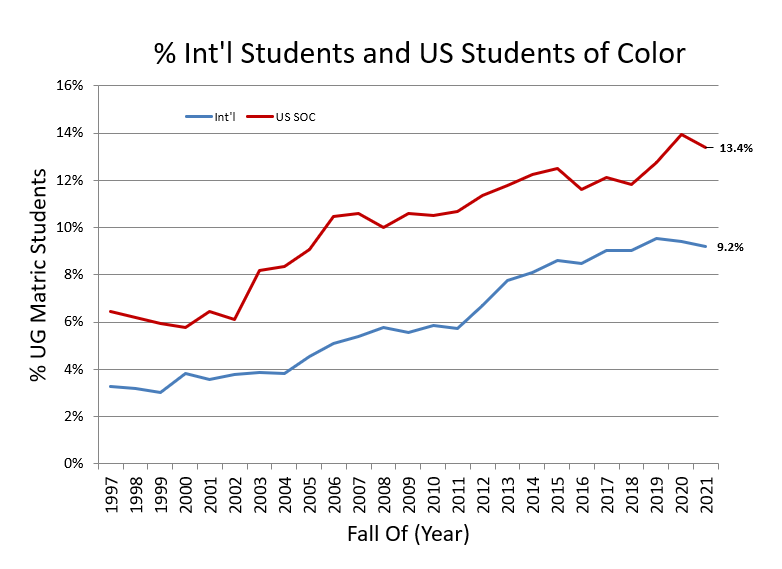
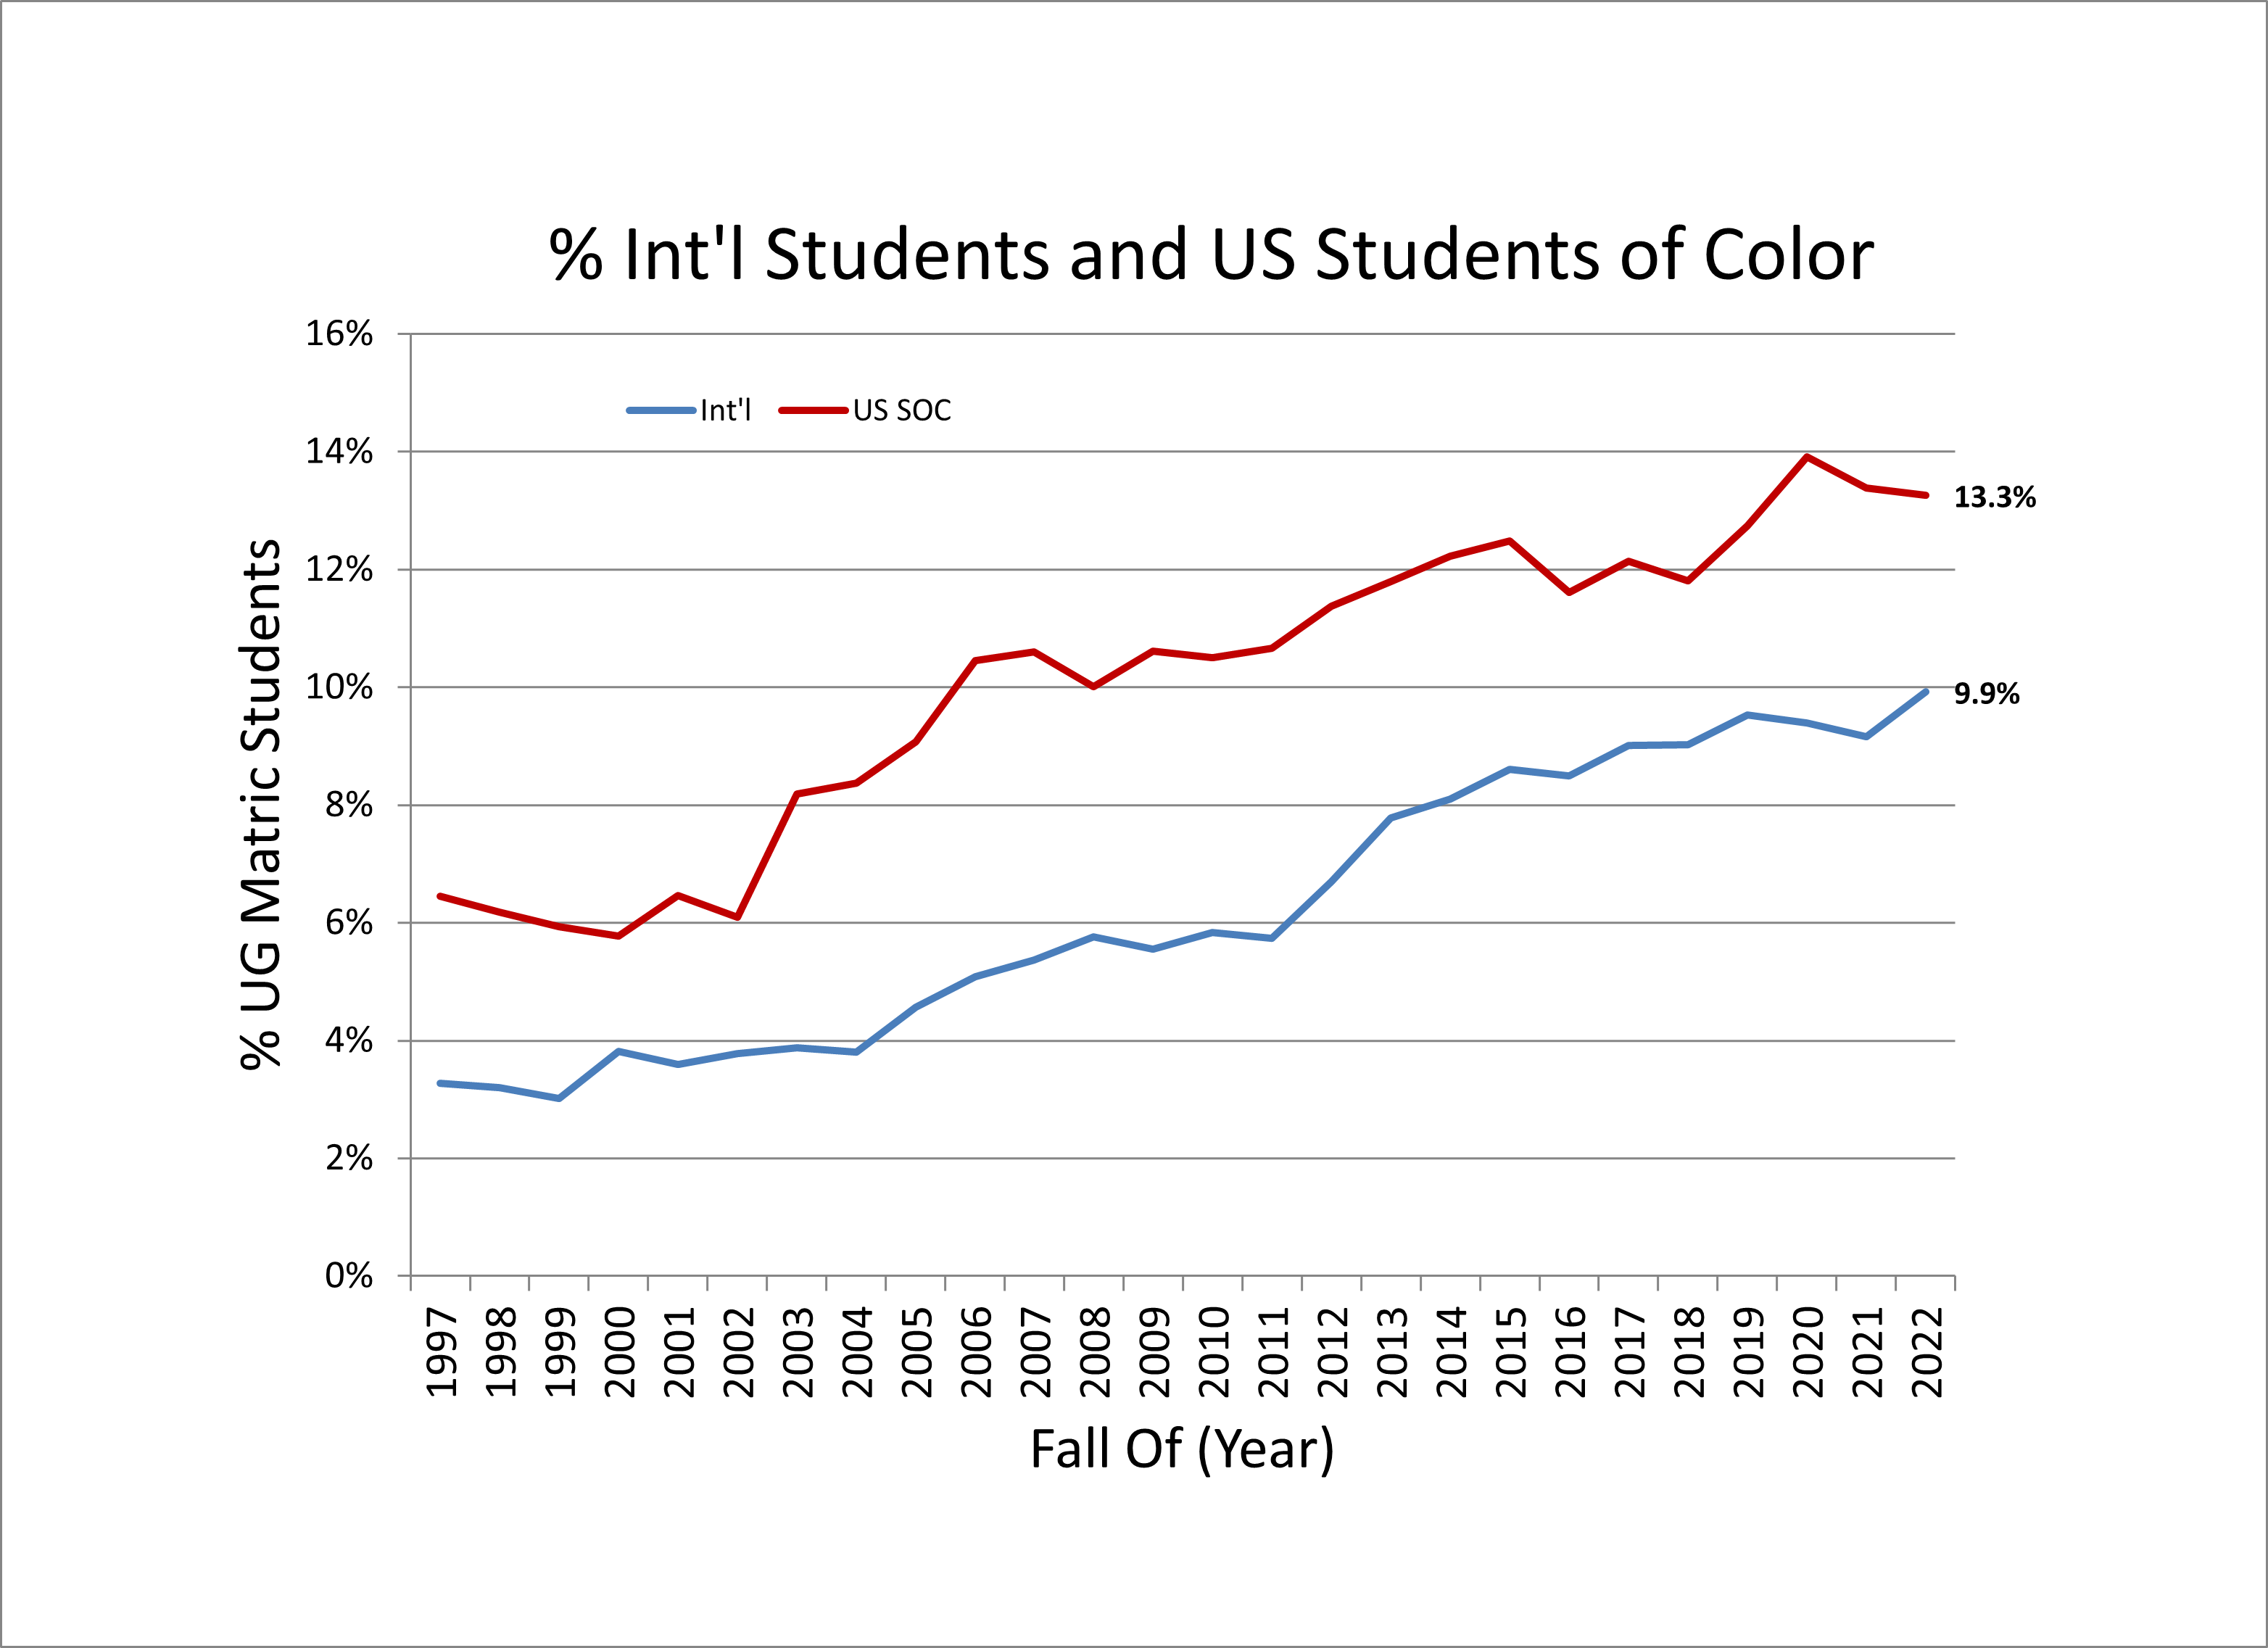
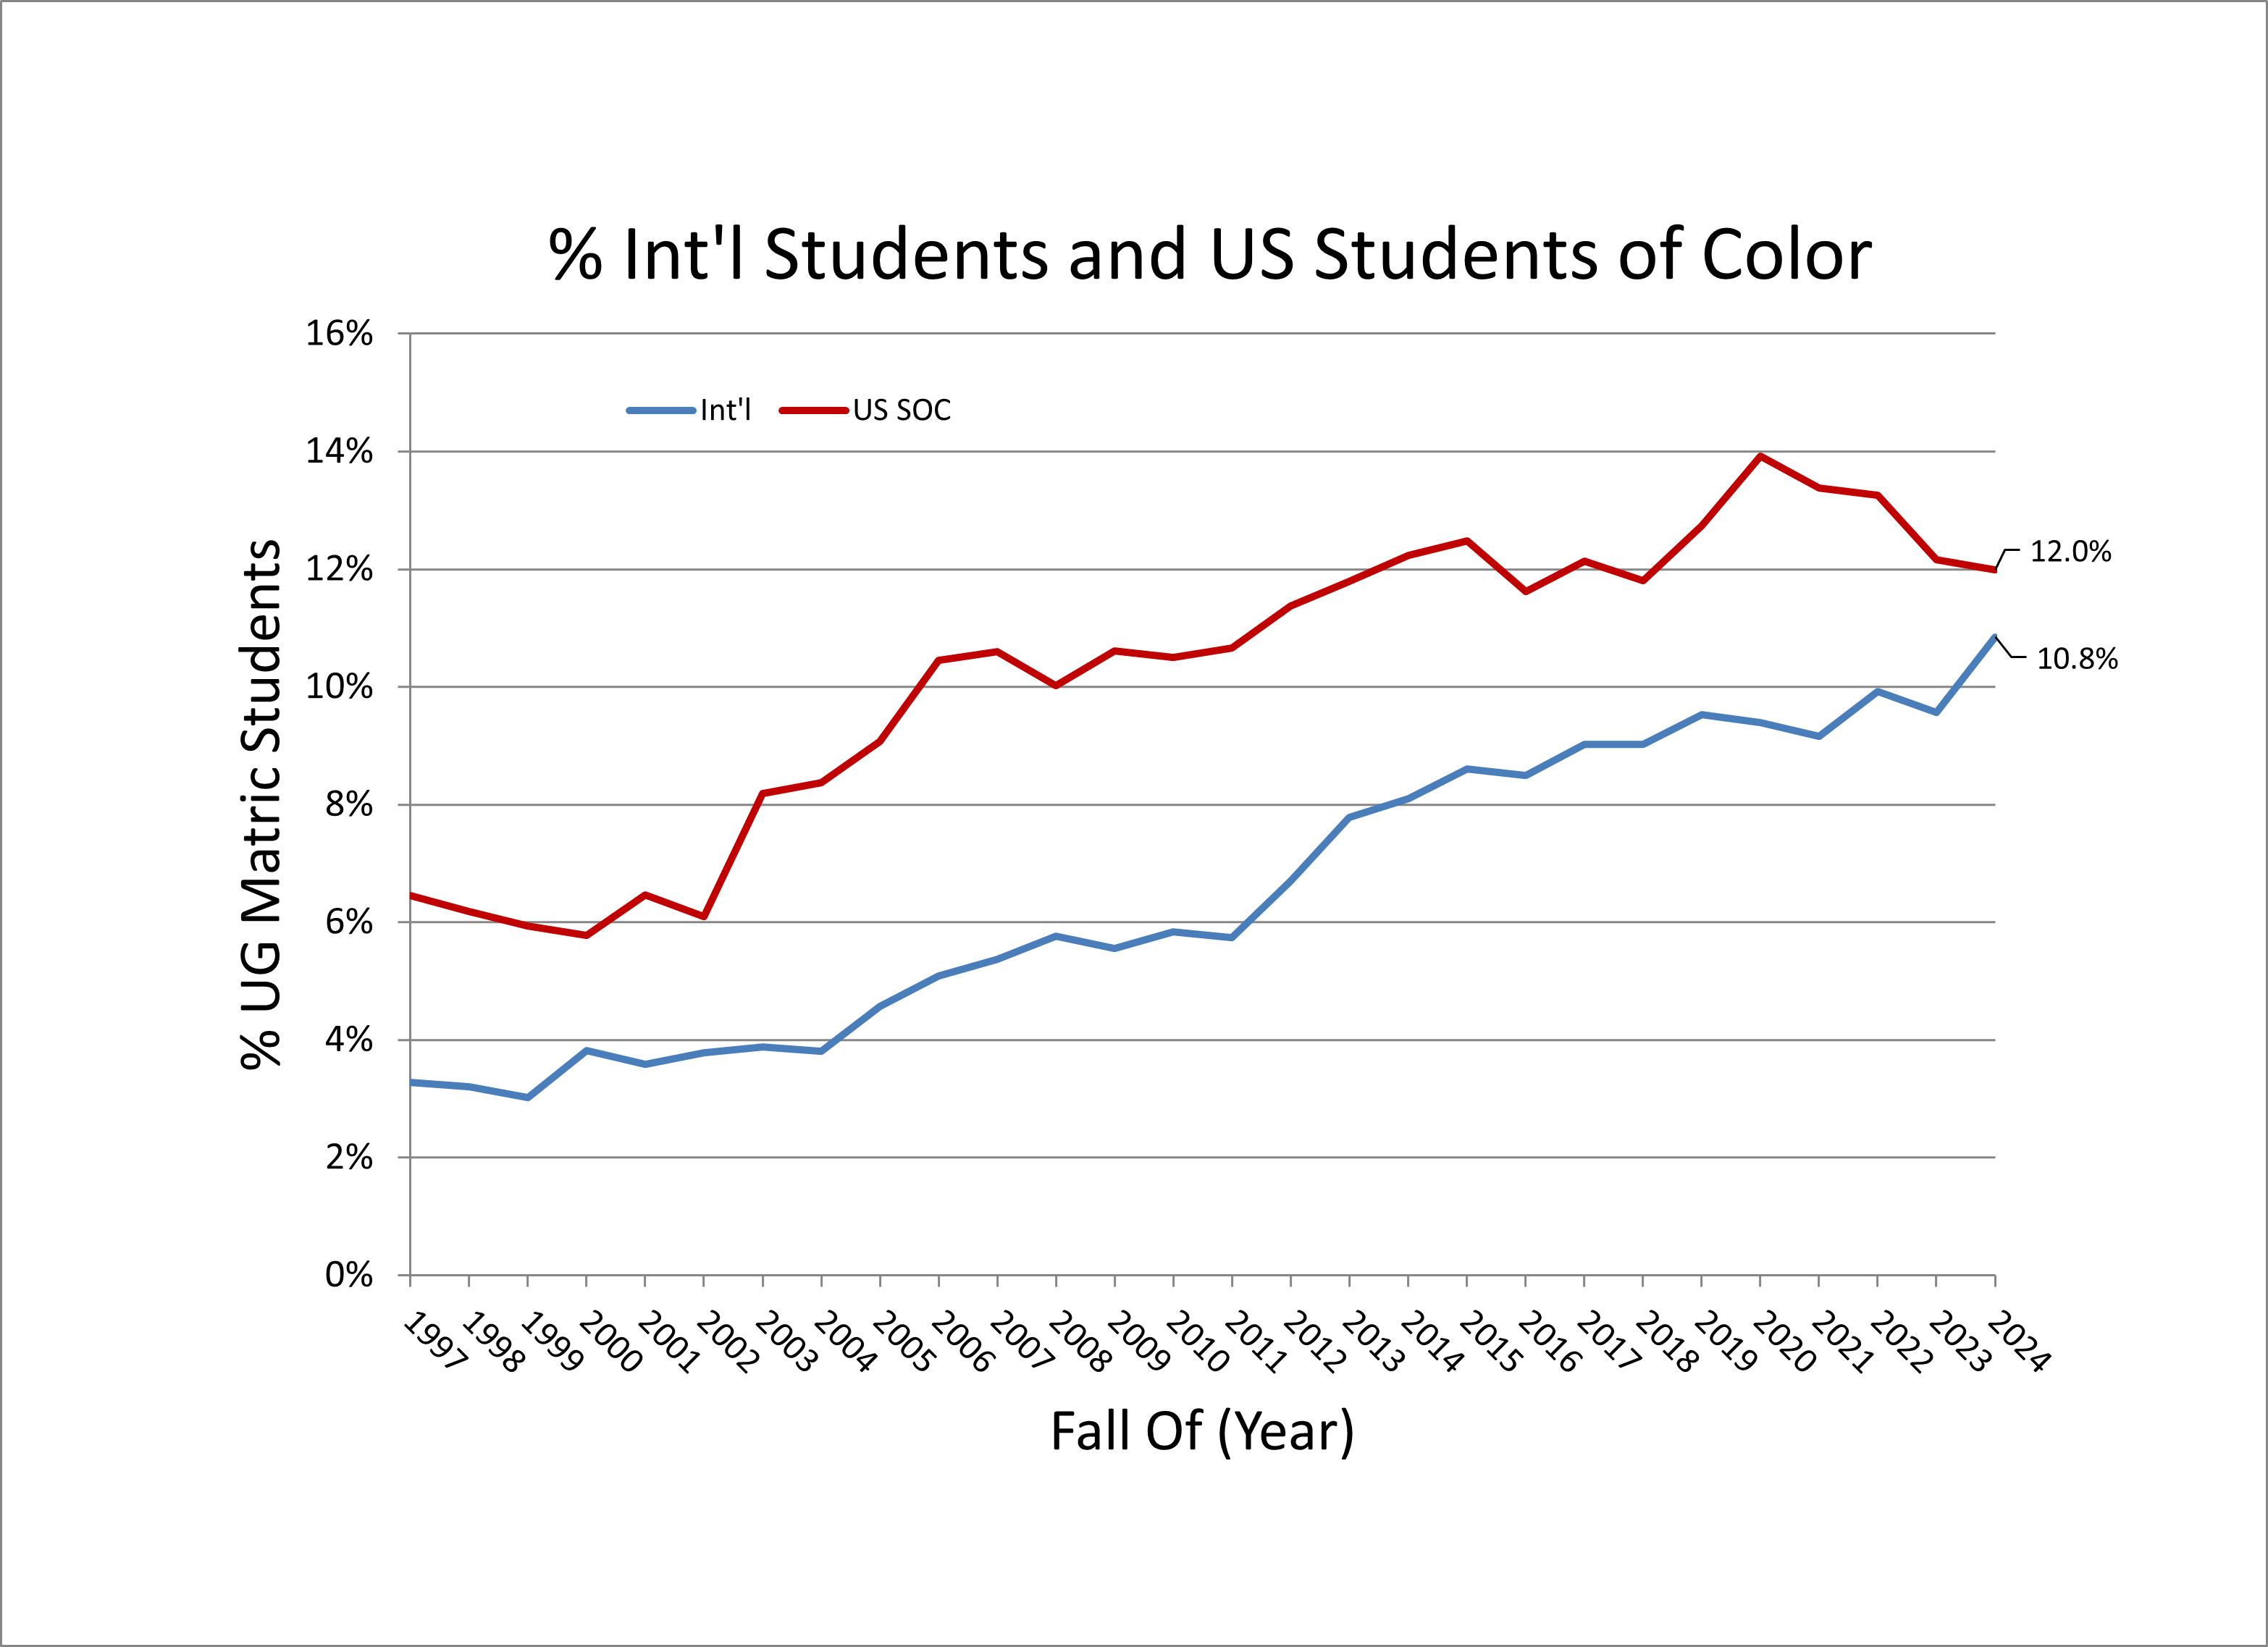
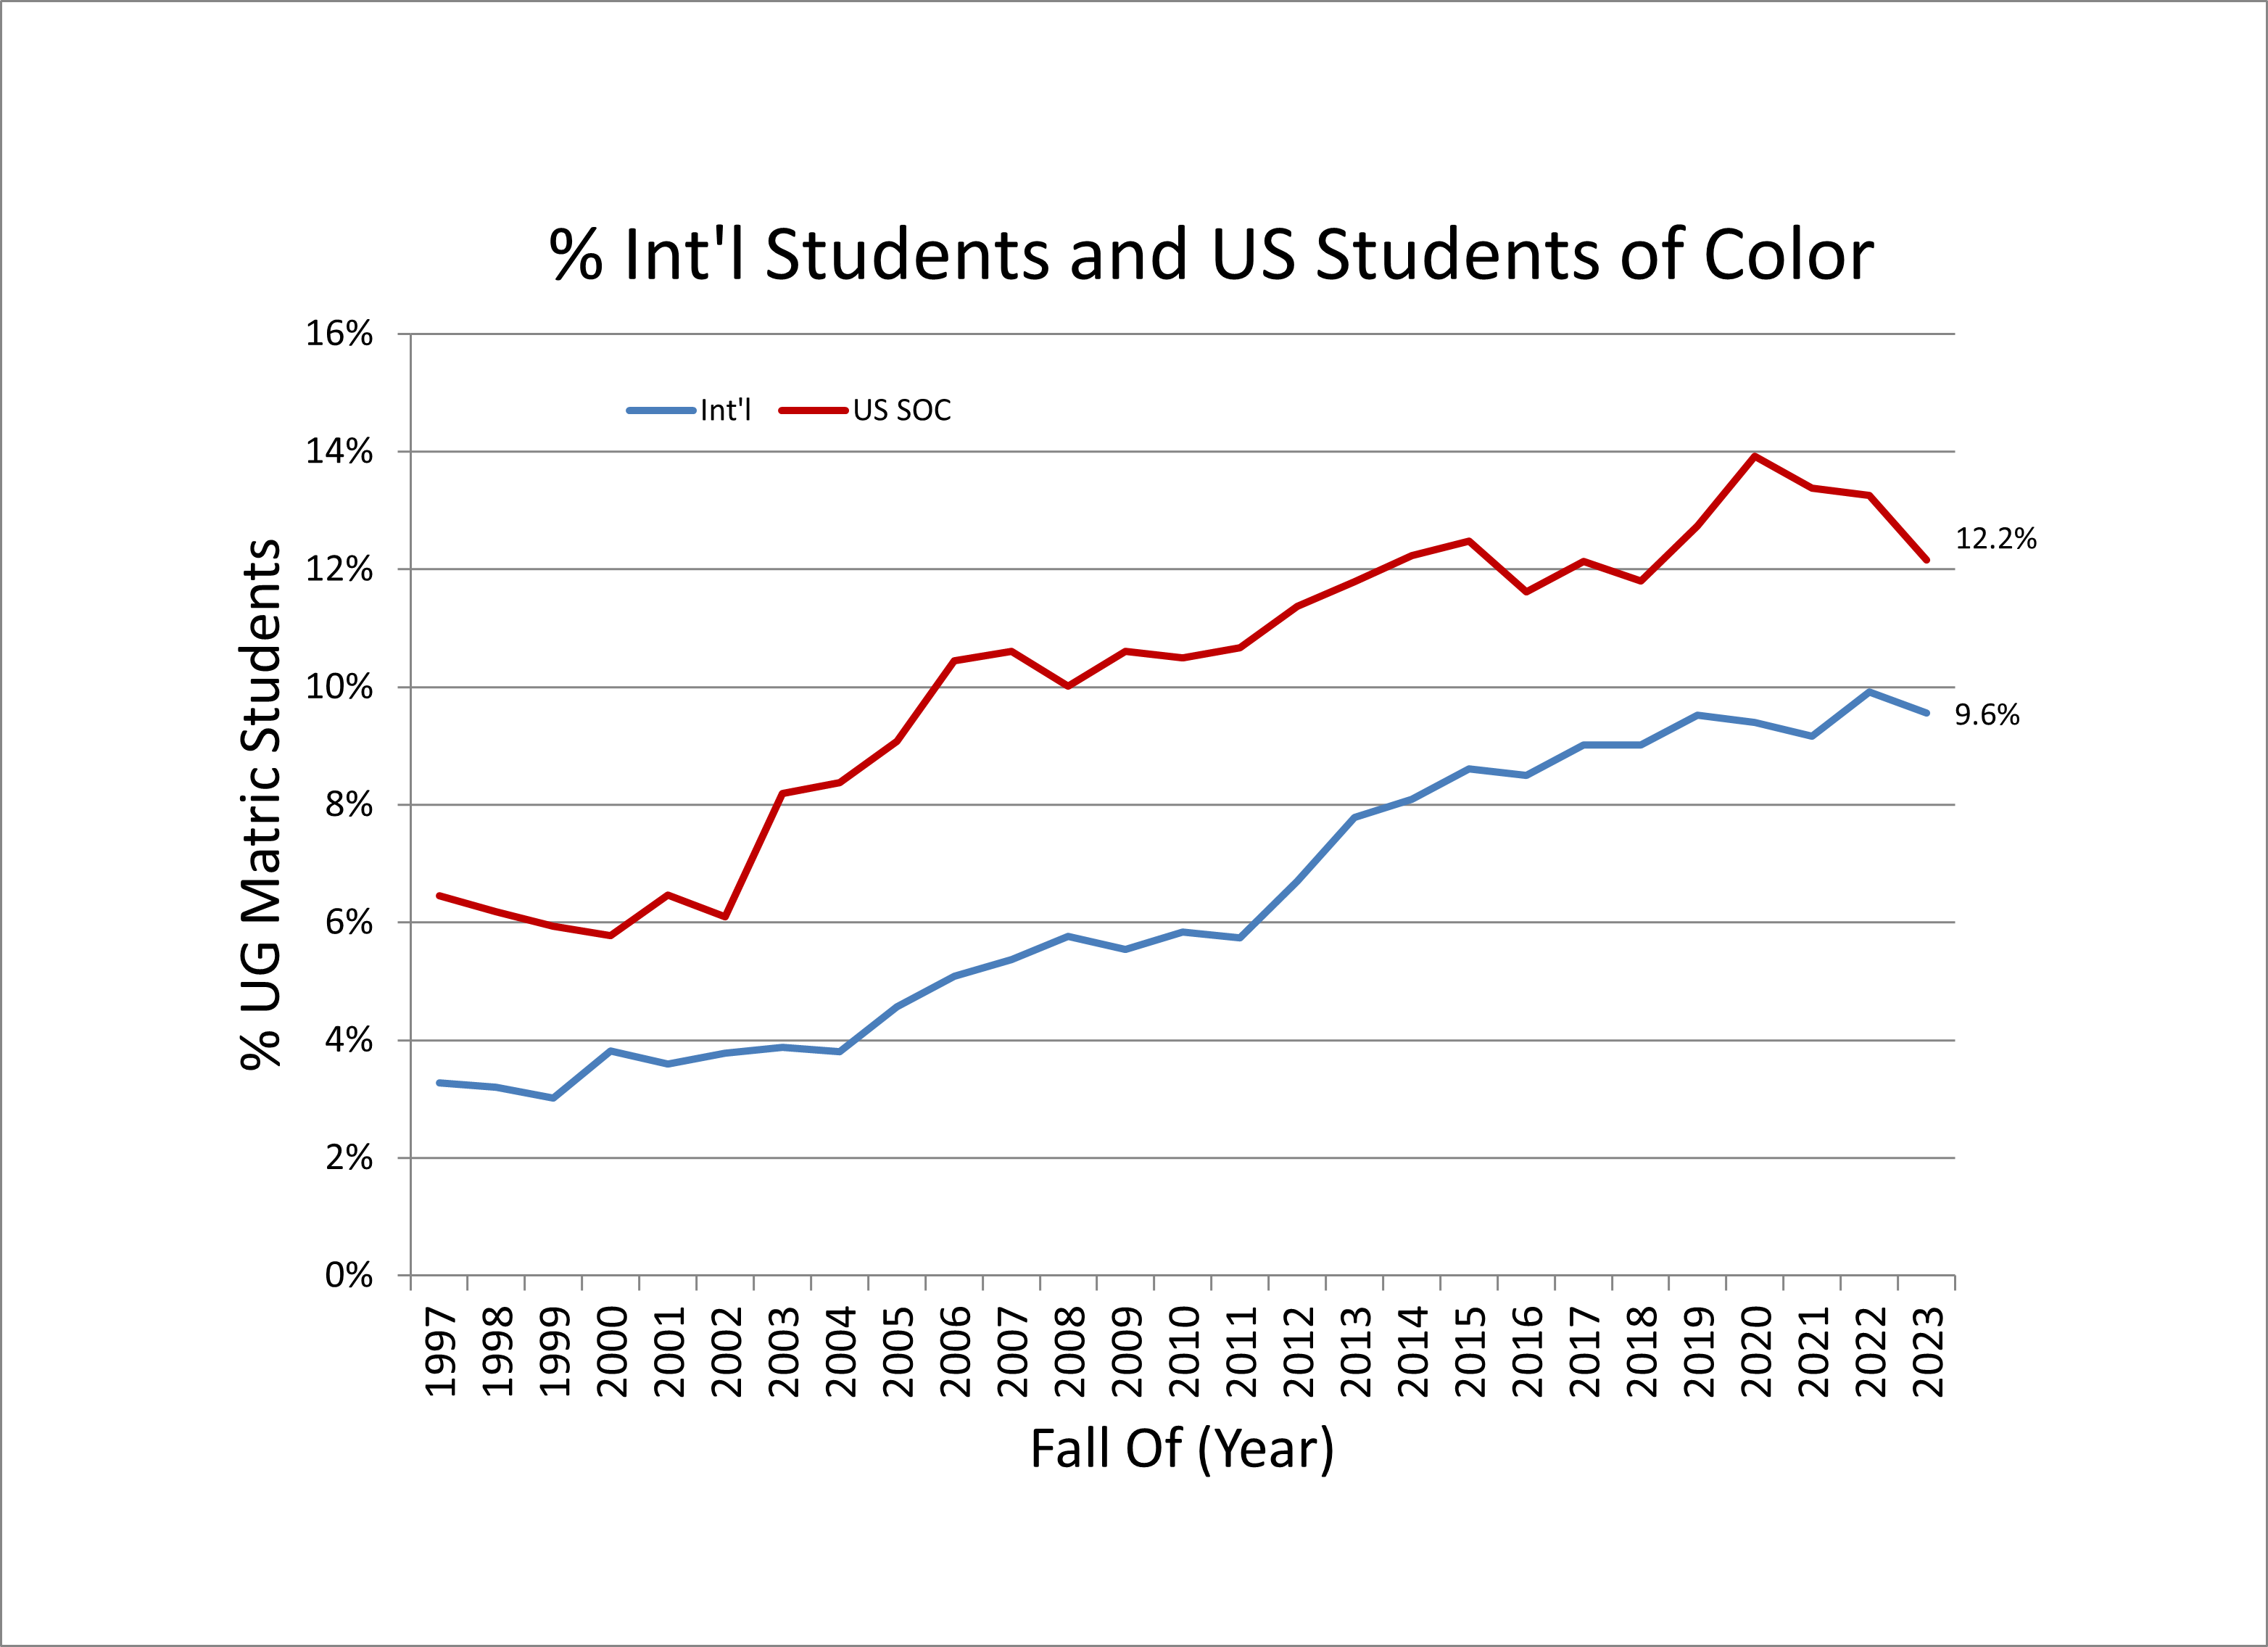
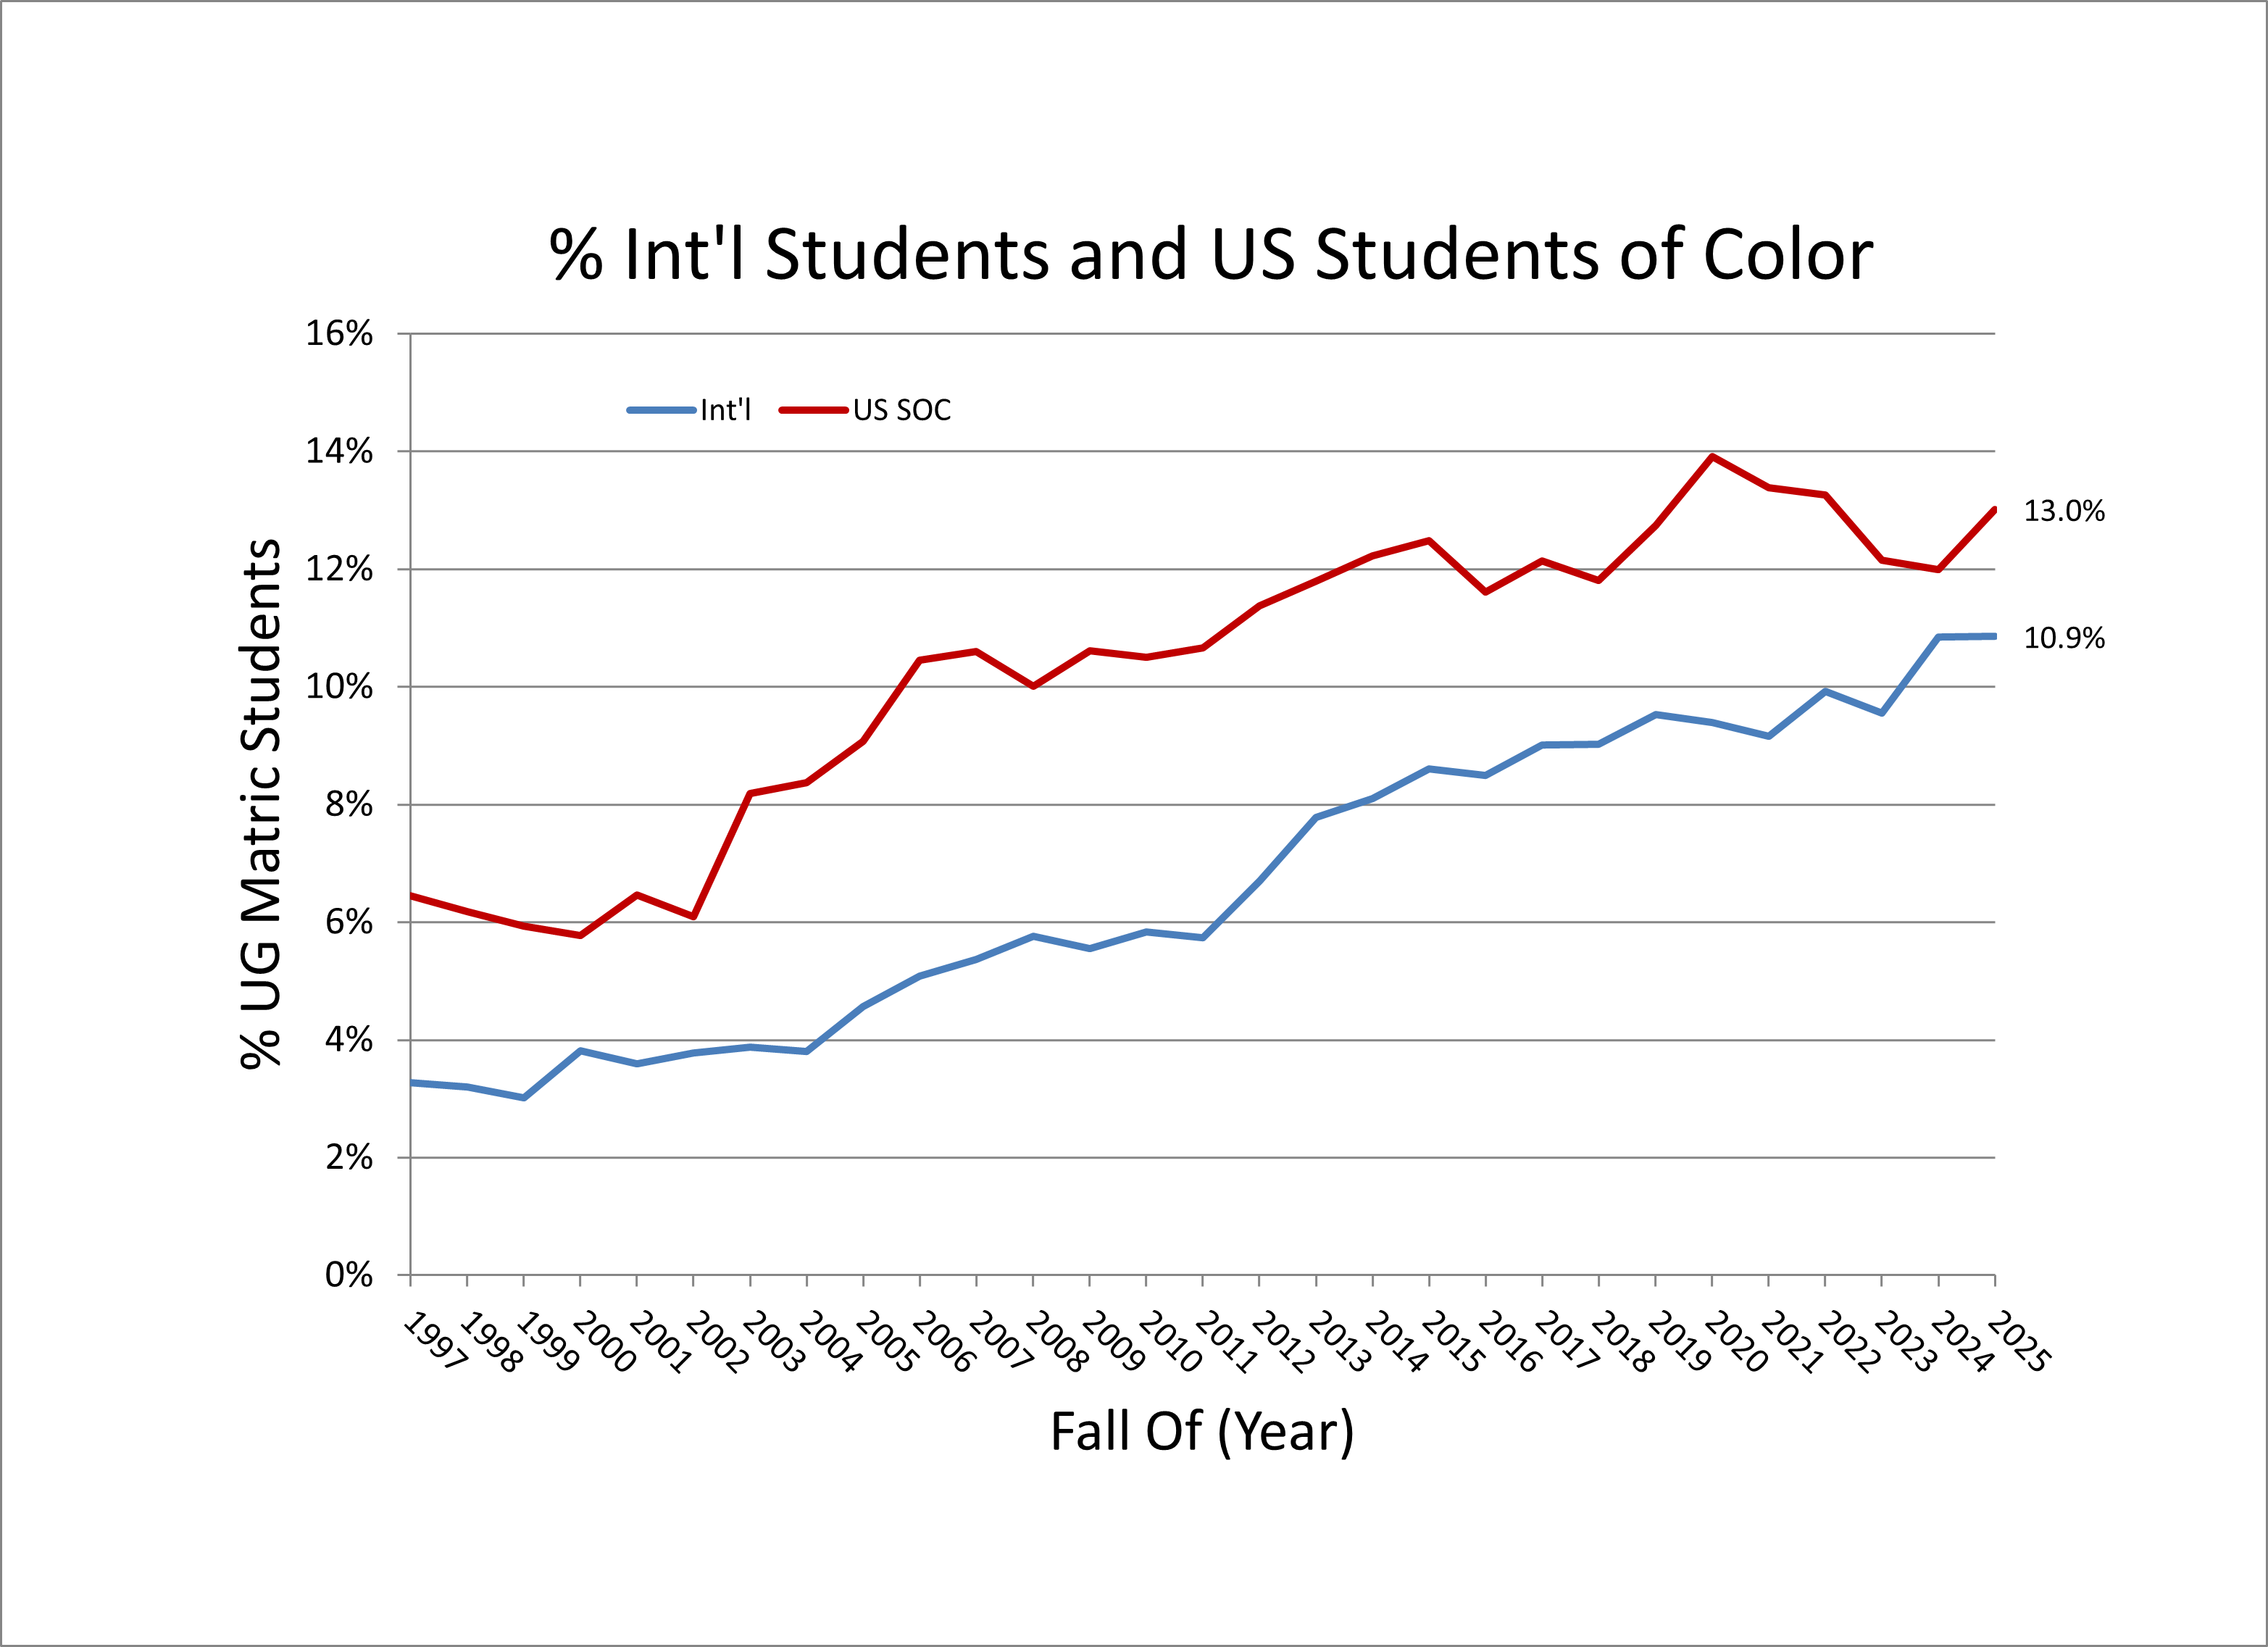
Search

  1. Student Diversity

    10.9%

    International Students

    13.0%

    US Students of Color

    Statistics as of Fall 2025.


    • Male: 49.3%
    • Female: 50.7%


    Race/EthnicityHeadcountPercent
    US Hispanic/Latino1035.9%
    US Black422.4%
    US Asian311.8%
    US Native American/American Indian90.5%
    US Nat Hawaiian/Pacific Islander10.1%
    US Multiracial/Other Minority432.4%
    Subtotal, US Students of Color22913.0%
    US White1,31674.8%
    US, Unknown231.3%
    Non-Resident Alien19110.9%
    Total, Undergrad Degree-Seeking1,759100.0%

    Socio-Economic Diversity

    Pell Grant Recipients: 23.3%

    International Students

    Top Nations Represented

    • Canada [42]
    • Kenya [13]
    • India [7]
    • Russia [6]
    • Dominican Republic [6]
    • Tanzania [6]


    Year
    2025
  2. Student Diversity 2021

    204

    International Students

    9.2%

    International Students

    13.4%

    US Students of Color

    Statistics as of Fall 2021.


    • Male: 46.2%
    • Female: 53.8%


    Race/EthnicityHeadcountPercent
    US Hispanic/Latino1325.9%
    US Black723.2%
    US Asian462.1%
    US Native American/American Indian50.2%
    US Nat Hawaiian/Pacific Islander10.0%
    US Multiracial/Other Minority421.9%
    Subtotal, US Students of Color29813.4%
    US White170876.7%
    US, Unknown170.8%
    Non-Resident Alien2049.2%
    Total, Undergrad Degree-Seeking2227100.0%


    Socio-Economic Diversity

    Pell Grant Recipients: 21.6%

    International Students

    Top Nations Represented

    • China [21]
    • Canada [45]
    • Kenya [9]
    • United Kingdom [76]
    • Italy [5]
    • Mexico [5]
    • Tanzania [5]


    Year
    2021
  3. Student Diversity 2022

    211

    International Students

    9.9%

    International Students

    13.3%

    US Students of Color

    Statistics as of Fall 2022.


    • Male: 45.8%
    • Female: 54.2%


    Race/EthnicityHeadcountPercent
    US Hispanic/Latino1306.1%
    US Black562.6%
    US Asian432.0%
    US Native American/American Indian70.3%
    US Nat Hawaiian/Pacific Islander10.0%
    US Multiracial/Other Minority452.1%
    Subtotal, US Students of Color28213.3%
    US White1,61275.8%
    US, Unknown221.0%
    Non-Resident Alien2119.9%
    Total, Undergrad Degree-Seeking2,127100.0%


    Socio-Economic Diversity

    Pell Grant Recipients: 19.8%

    International Students

    Top Nations Represented

    • Canada [47]
    • China [13]
    • Kenya [10]
    • Tanzania [8]
    • India [6], Mexico [6]
    • United Kingdom [4], Italy [4], Albania [4]


    Year
    2022
  4. Student Diversity 2024

    10.8%

    International Students

    12.0%

    US Students of Color

    Statistics as of Fall 2024.


    • Male: 47.5%
    • Female: 52.5%


    Race/EthnicityHeadcountPercent
    US Hispanic/Latino1065.5%
    US Black422.2%
    US Asian331.7%
    US Native American/American Indian90.5%
    US Nat Hawaiian/Pacific Islander00.0%
    US Multiracial/Other Minority402.1%
    Subtotal, US Students of Color22711.8%
    US White1,45375.7%
    US, Unknown271.4%
    Non-Resident Alien20810.8%
    Total, Undergrad Degree-Seeking1918100.0%

    Socio-Economic Diversity

    Pell Grant Recipients: 21.6%

    International Students

    Top Nations Represented

    • Canada [52]
    • Kenya [12]
    • Tanzania [12]
    • India [6]
    • Nepal [5]


    Year
    2024
  5. Student Diversity 2023

    9.6%

    International Students

    12.2%

    US Students of Color

    Statistics as of Fall 2023.


    • Male: 45.5%
    • Female: 54.5%


    Race/EthnicityHeadcountPercent
    US Hispanic/Latino1115.4%
    US Black432.1%
    US Asian341.7%
    US Native American/American Indian120.6%
    US Nat Hawaiian/Pacific Islander10.0%
    US Multiracial/Other Minority472.3%
    Subtotal, US Students of Color24812.2%
    US White1,56876.9%
    US, Unknown291.4%
    Non-Resident Alien1959.5%
    Total, Undergrad Degree-Seeking2,040100.0%

    Socio-Economic Diversity

    Pell Grant Recipients: 21.7%

    International Students

    Top Nations Represented

    • Canada [50]
    • Kenya [11]
    • India [9]
    • Tanzania [8]
    • China [7], United Kingdom [7]
    • Dominican Republic [5]


    Year
    2023
  6. Student Diversity 2020

    212

    International Students

    9.4%

    International Students

    13.9%

    US Students of Color

    Statistics as of Fall 2020


    • Male: 45%
    • Female: 55%


    Race/EthnicityHeadcountPercent
    US Hispanic/Latino1376.1%
    US Black823.6%
    US Asian442.0%
    US Native American/American Indian50.2%
    US Nat Hawaiian/Pacific Islander10.0%
    US Multiracial/Other Minority452.0%
    Subtotal, US Students of Color31413.9%
    US White171375.9%
    US, Unknown170.8%
    Non-Resident Alien2129.4%
    Total, Undergrad Degree-Seeking2256100.0%


    Socio-Economic Diversity

    Pell Grant Recipients: 21.0%

    International Students

    Top Nations Represented

    • China [46]
    • Canada [43]
    • Kenya [10]
    • South Korea [8]
    • Mexico [6]]
    • Vietnam [5]


    Year
    2020
  7. Outcomes: Overview 2022

    95%

    Career Outcome, Class of 2021

    Based on a reporting rate of 69.4% and a graduating class size of 532 students; Source: Career Services Follow-Up Survey

    80%

    Class of 2021 employed

    From the Career Services Follow-Up Survey, Class of 2021

    17%

    Class of 2021 enrolled in further study

    From the Career Services Follow-Up Survey, Class of 2021

    40%

    Continue education within 5 years

    Data from National Student Clearinghouse + Career Services, based on classes of 2013-2017

    21%

    Earn a post-baccalaureate degree within 5 years

    Data from National Student Clearinghouse + Career Services, based on classes of 2013-2017

    This section provides information on graduate school, employment, and other outcome-related information for the class of 2021 using the Follow-Up Survey of the Center for Career Excellence, conducted 7-10 months post-graduation.  For more information, select one of the tabs above or read the full report.


    See below for more information on:

    Year
    2022
  8. Outcomes: Overview 2023

    95%

    Career Outcome, Class of 2022

    Based on a reporting rate of 72% and a graduating class size of 527 students; Source: Career Services Follow-Up Survey

    78%

    Class of 2022 employed

    From the Career Services Follow-Up Survey, Class of 2022

    17%

    Class of 2022 enrolled in further study

    From the Career Services Follow-Up Survey, Class of 2022

    39%

    Continue education within 5 years

    Data from National Student Clearinghouse + Career Services, based on classes of 2014-2018

    22%

    Earn a post-baccalaureate degree within 5 years

    Data from National Student Clearinghouse + Career Services, based on classes of 2014-2018

    This section provides information on graduate school, employment, and other outcome-related information for the class of 2022 using the Follow-Up Survey of the Center for Career Excellence, conducted 7-10 months post-graduation.  For more information, select one of the tabs above or read the executive summary and full report here.


    See below for more information on:

    Year
    2023
  9. Outcomes: Overview 2021

    92%

    Career Outcome, Class of 2020

    Based on a reporting rate of 69.2% and a graduating class size of 509 students; Source: Career Services Follow-Up Survey

    75%

    Class of 2020 employed

    From the Career Services Follow-Up Survey, Class of 2020

    17%

    Class of 2020 enrolled in further study

    From the Career Services Follow-Up Survey, Class of 2020

    42%

    Continue education within 5 years

    Data from National Student Clearinghouse + Career Services, based on classes of 2012-2016

    21%

    Earn a post-baccalaureate degree within 5 years

    Data from National Student Clearinghouse + Career Services, based on classes of 2012-2016

    This section provides information on graduate school, employment, and other outcome-related information for the class of 2020 using the Follow-Up Survey of the Center for Career Excellence, conducted 7-10 months post-graduation.  For more information, select one of the tabs above or read the full report.


    See below for more information on:

    Year
    2021
  10. Outcomes: Overview 2013

    94.1%

    Career Outcome, Class of 2012

    Based on a reporting rate of 78.9% and a graduating class size of 557 students; Source: Career Services Follow-Up Survey

    71.6%

    Class of 2012 employed

    From the Career Services Follow-Up Survey, Class of 2012

    20.5%

    Class of 2012 enrolled in further study

    From the Career Services Follow-Up Survey, Class of 2012

    51%

    Attend grad school within 5 years

    Data from National Student Clearinghouse + Career Services, based on classes of 2004-2008

    24%

    Earn a graduate degree within 5 years

    Data from National Student Clearinghouse + Career Services, based on classes of 2004-2008

    This section provides information on graduate school, careers, and other outcome-related information for the class of 2012. For more information select one of the tabs above or read the full report to your right.

    Experiential Learning

    An overview of experiential learning for the Class of 2012 from senior survey and registrar's office information:

    • Research Experience: 78%
    • Studied Off-Campus: 63%
    • Participated in an Internship: 60%
    • Community Service: 68%
    Year
    2013