Outcomes: Overview 2022
Career Outcome, Class of 2021
Based on a reporting rate of 69.4% and a graduating class size of 532 students; Source: Career Services Follow-Up Survey
Class of 2021 employed
From the Career Services Follow-Up Survey, Class of 2021
Class of 2021 enrolled in further study
From the Career Services Follow-Up Survey, Class of 2021
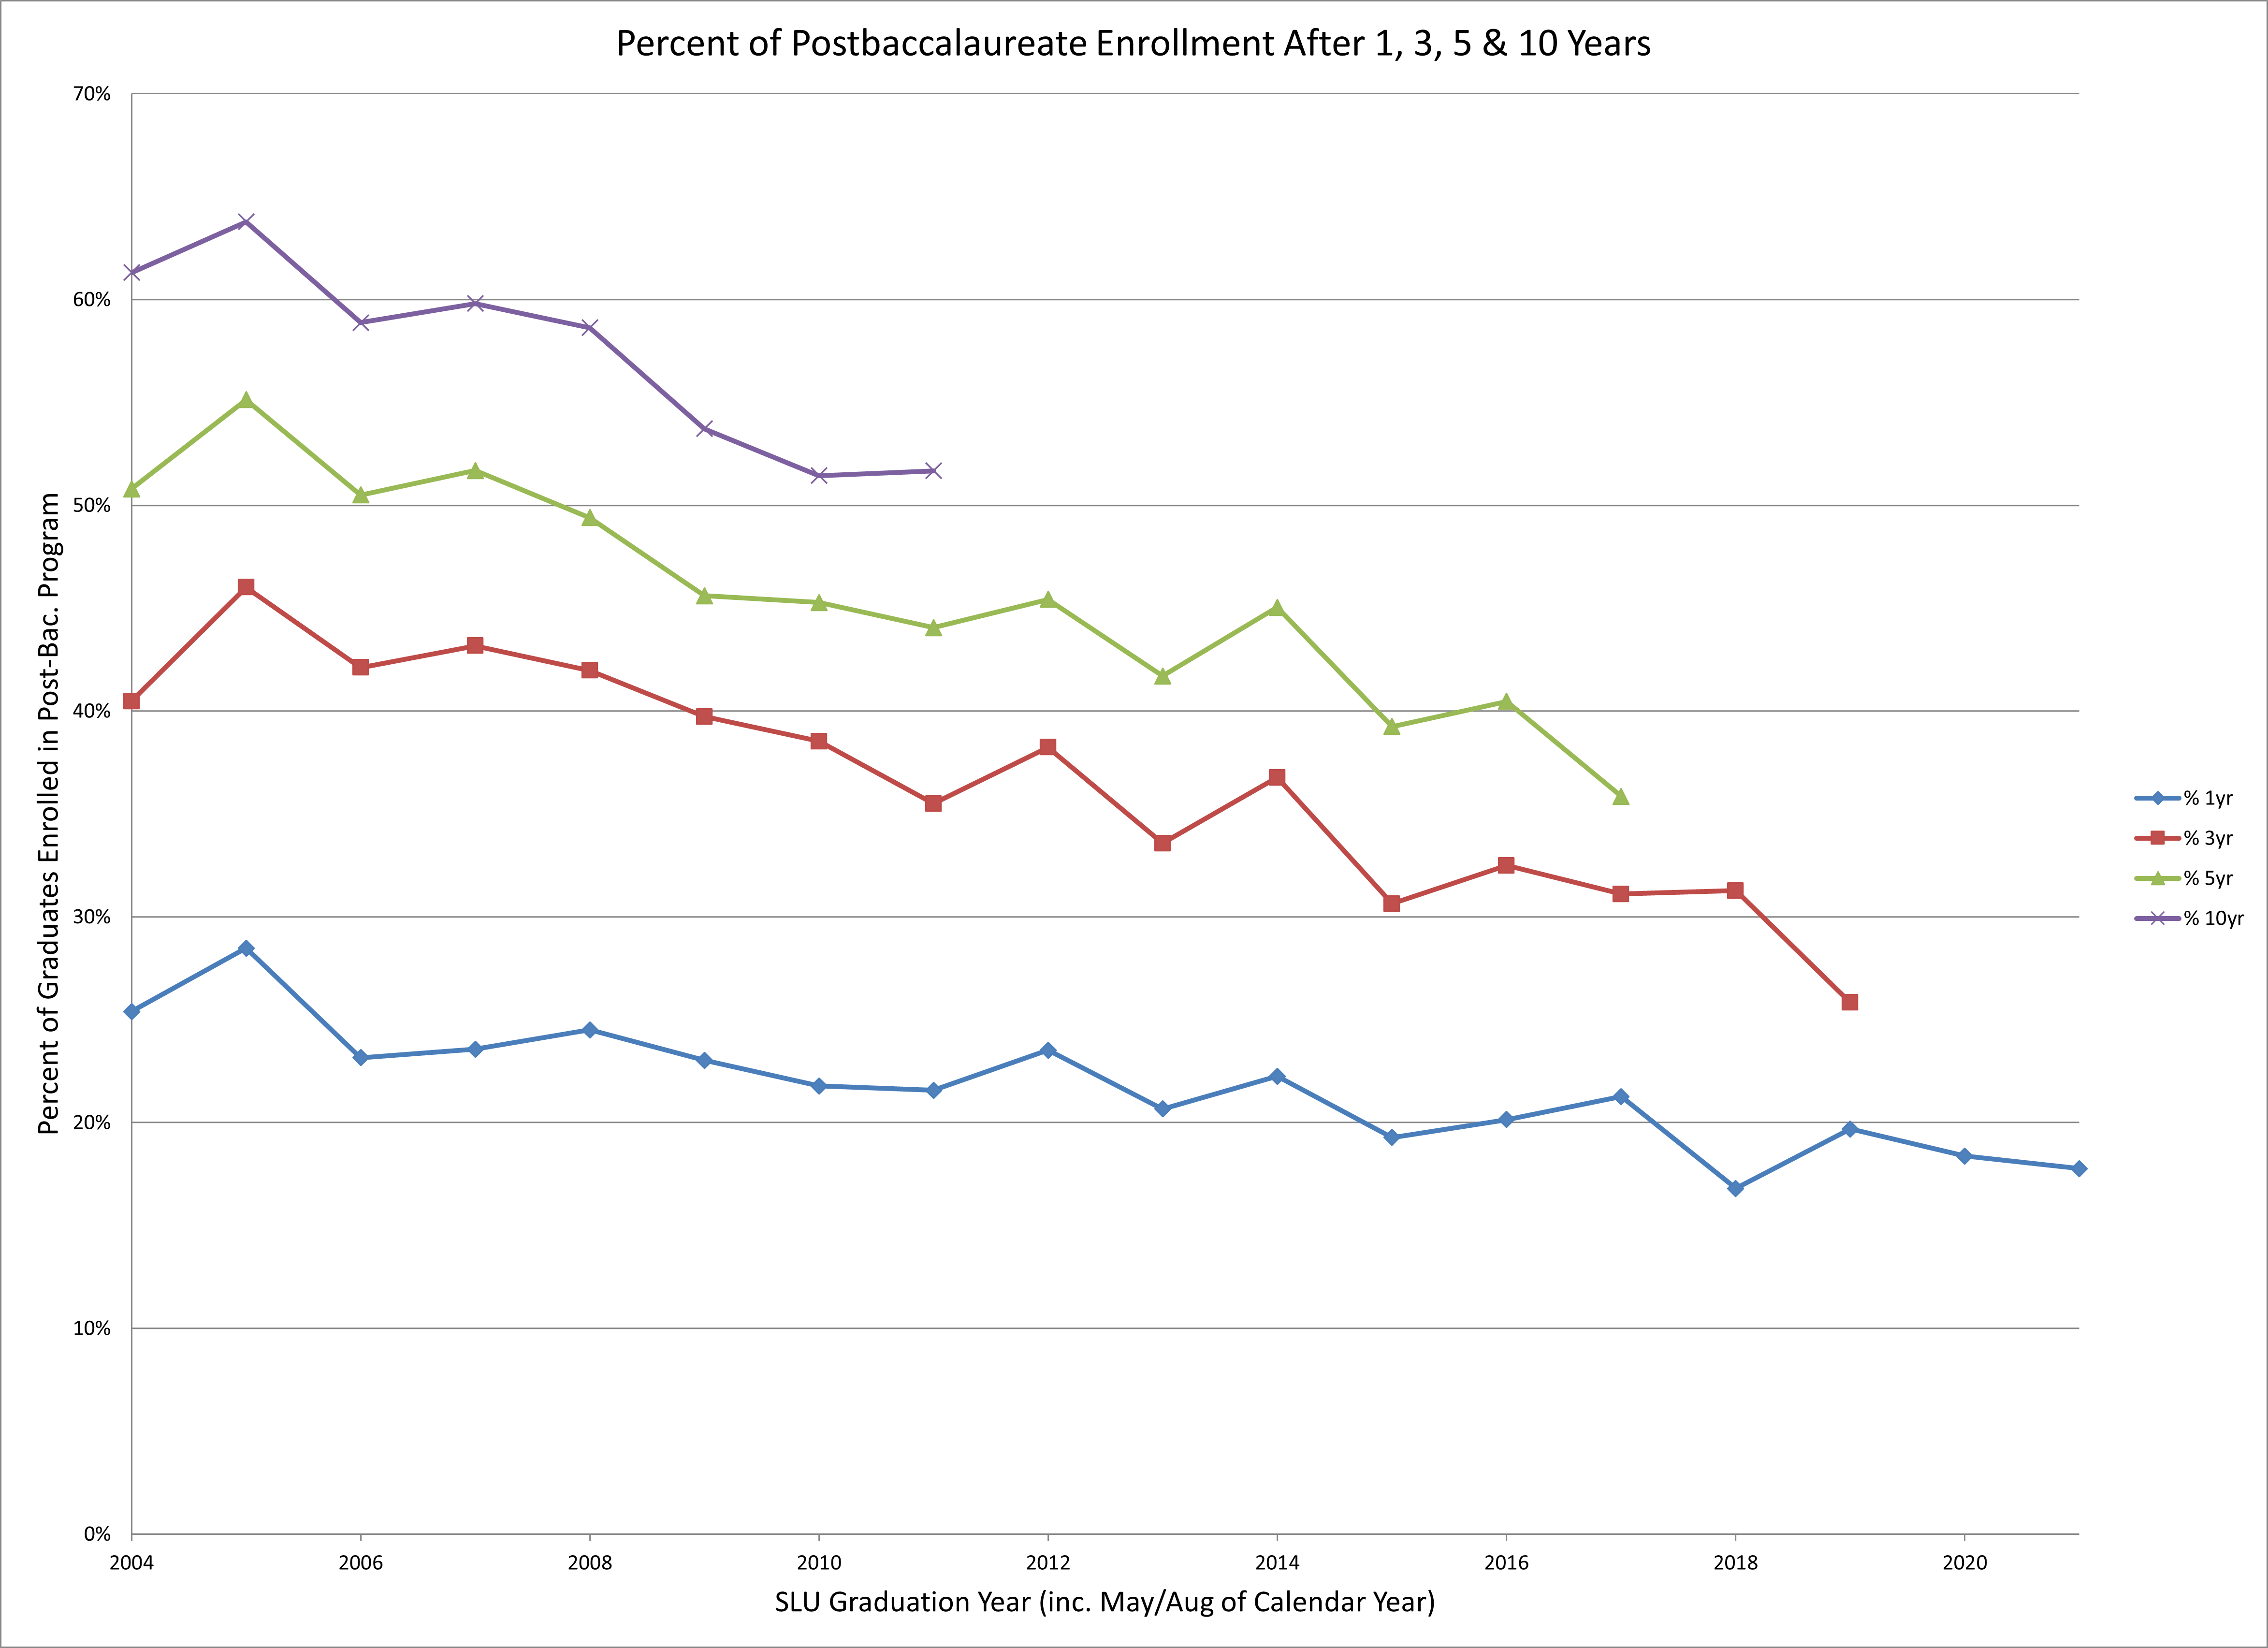
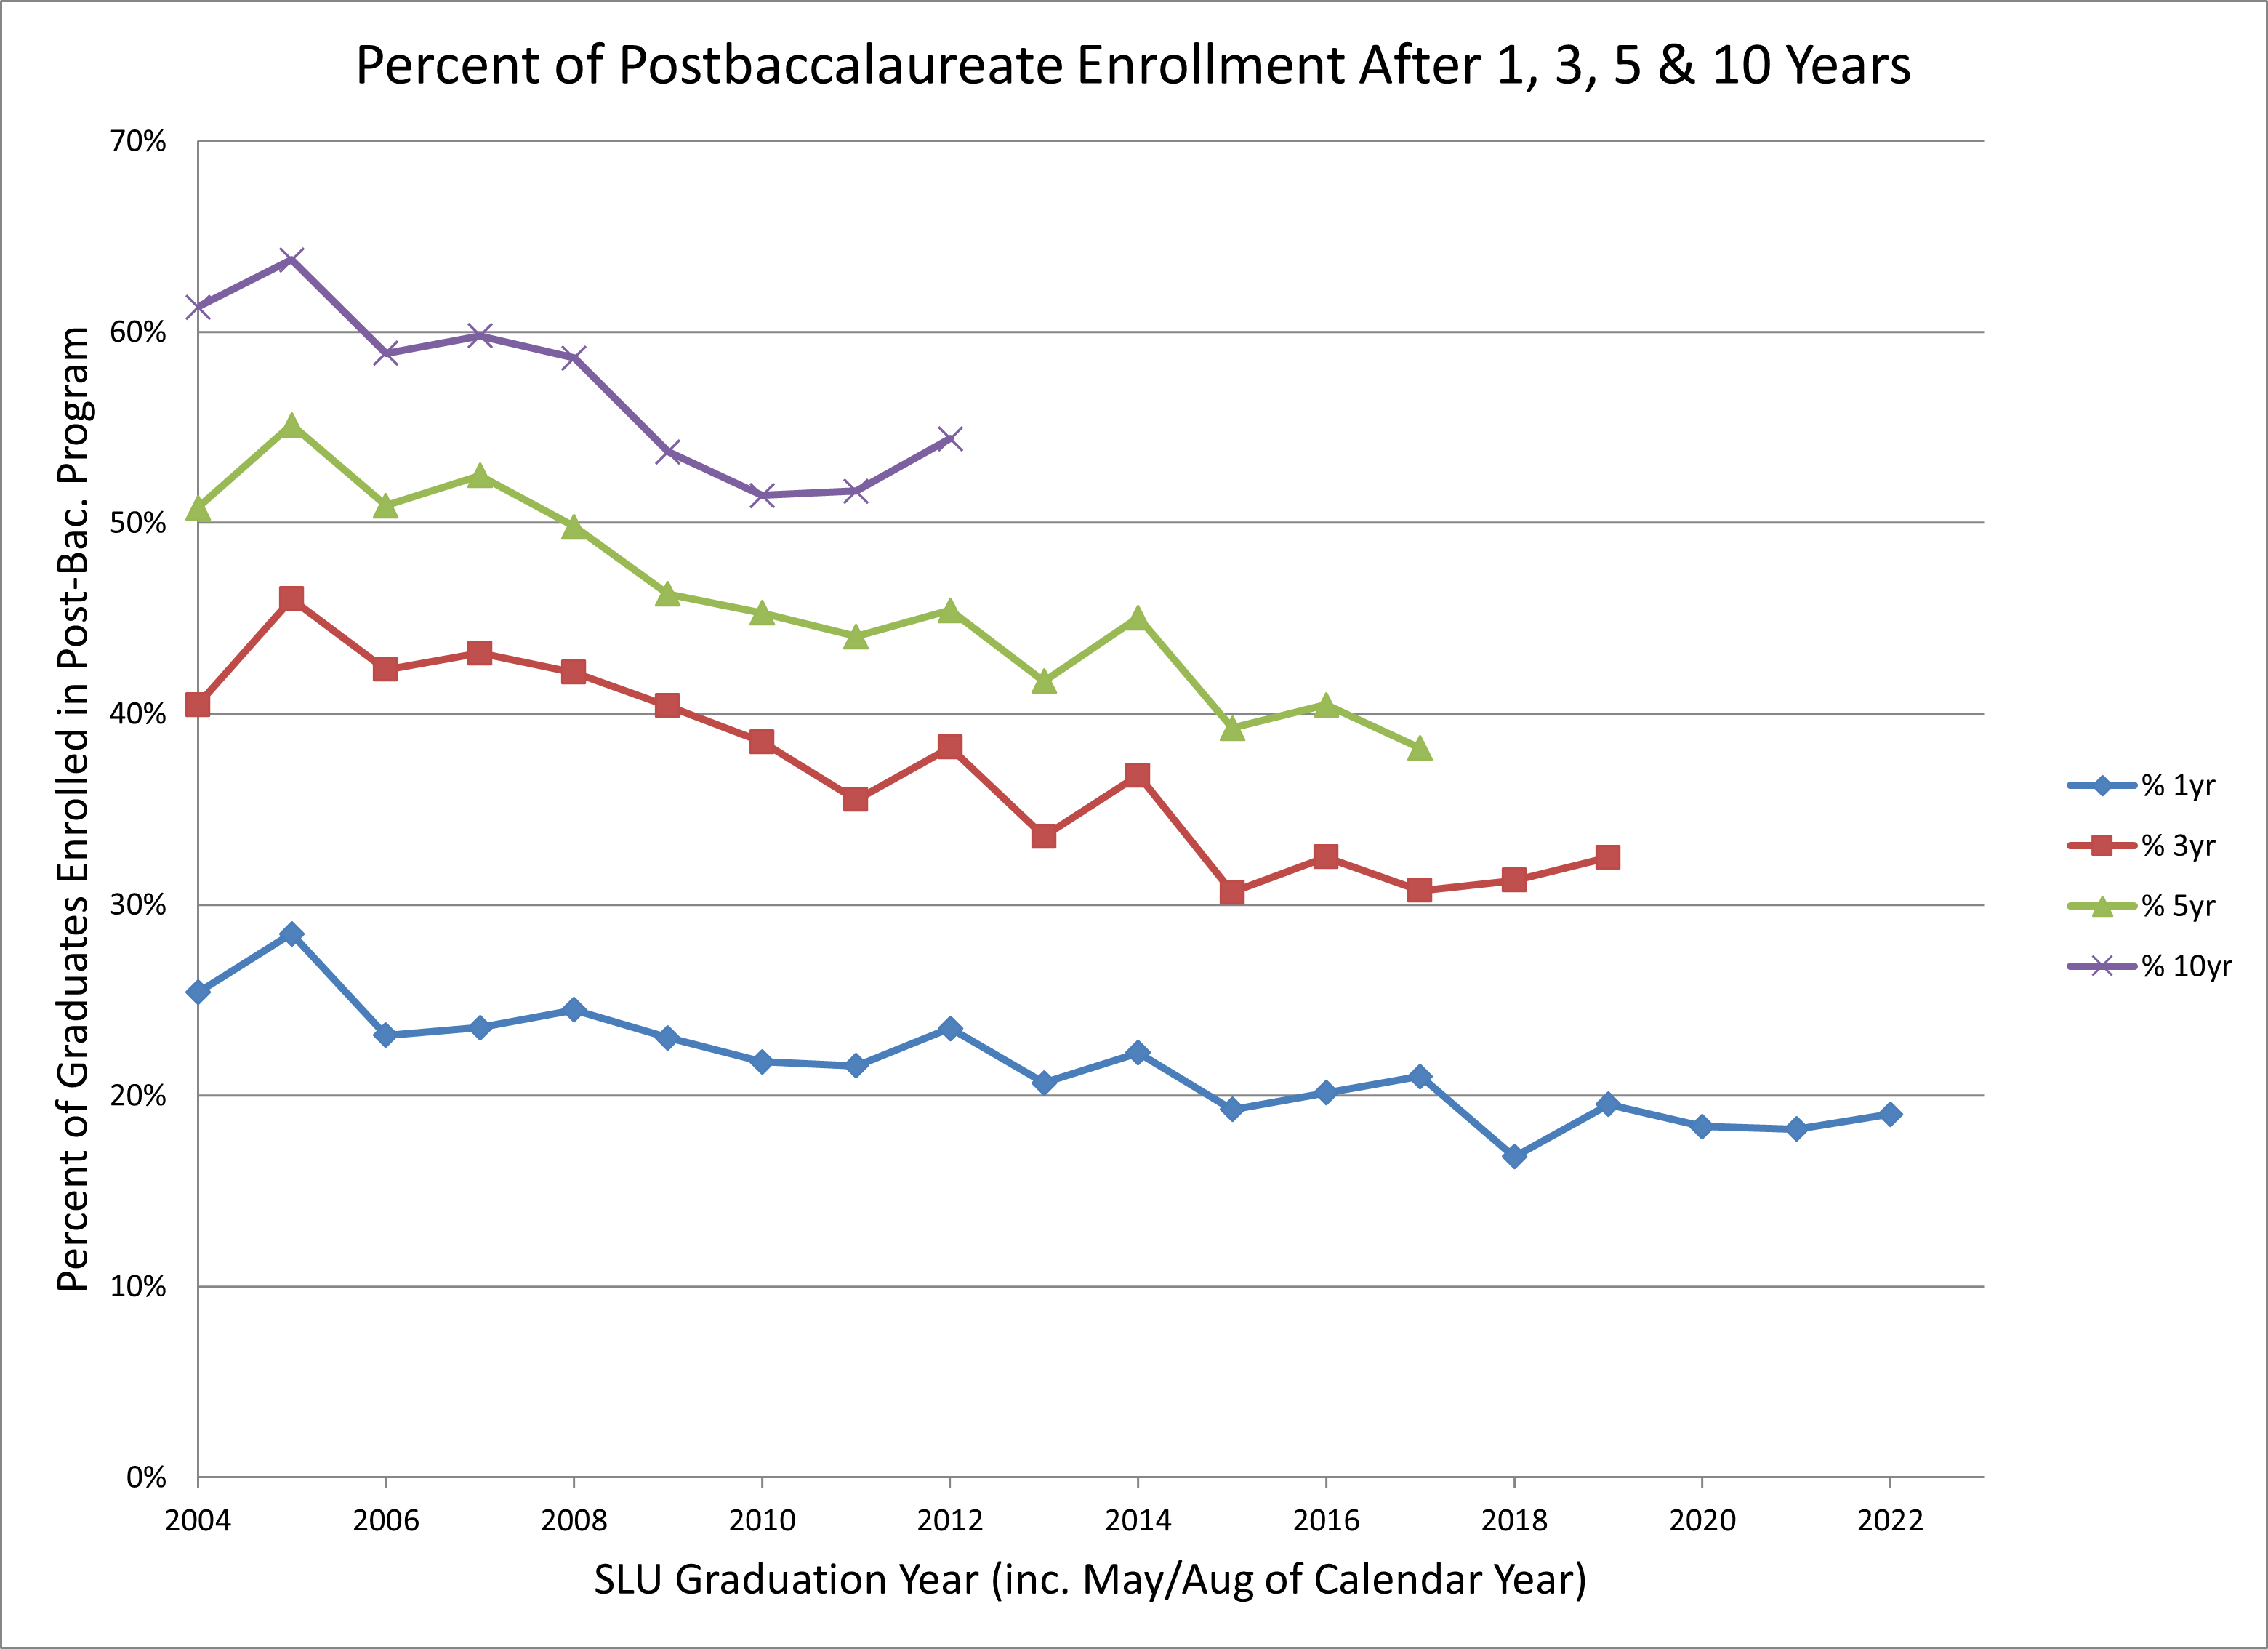
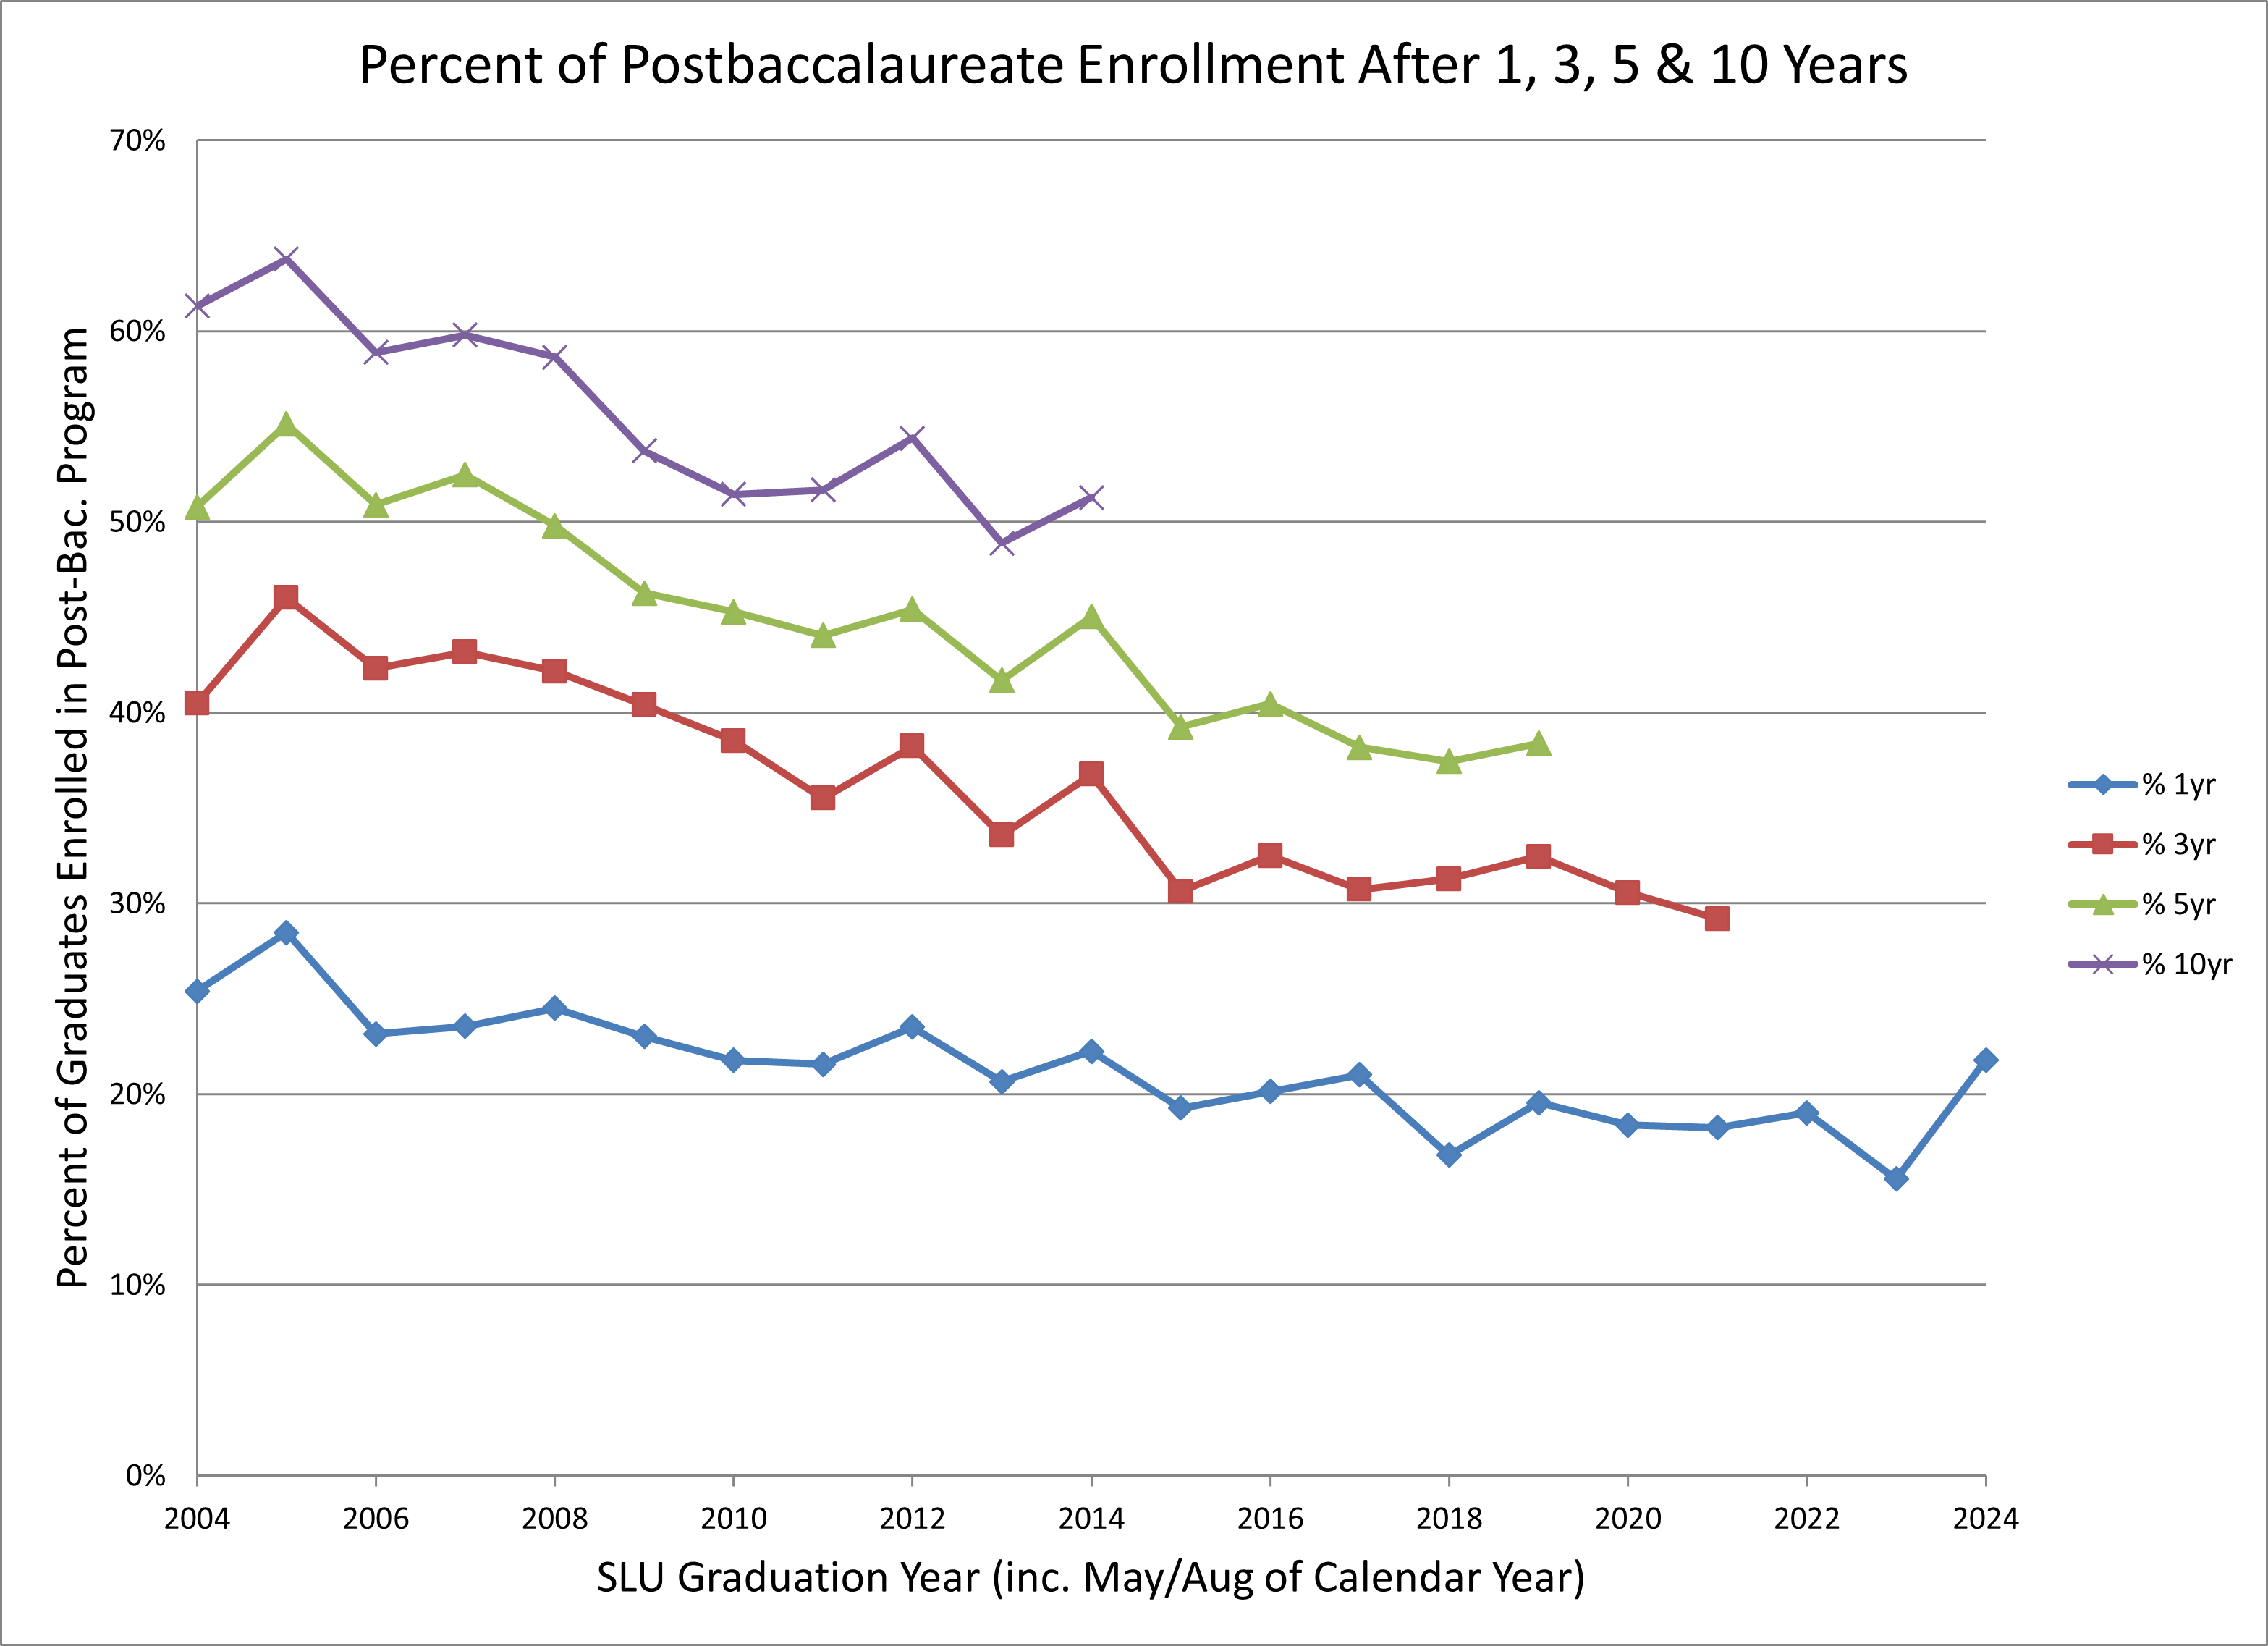
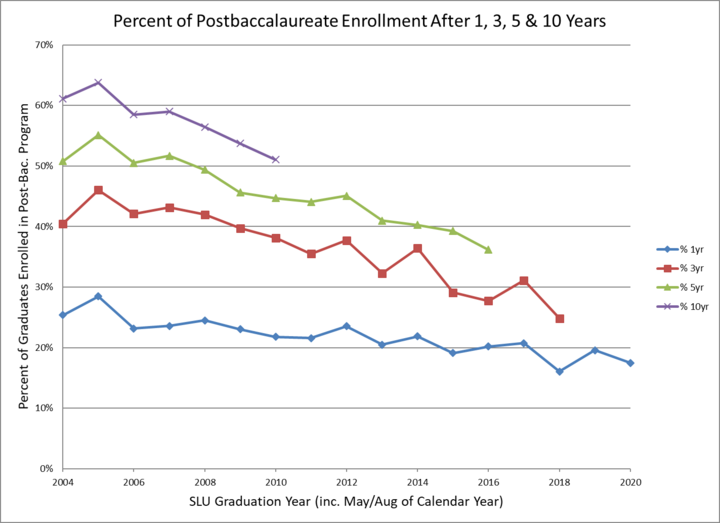
Continue education within 5 years
Data from National Student Clearinghouse + Career Services, based on classes of 2013-2017
Earn a post-baccalaureate degree within 5 years
Data from National Student Clearinghouse + Career Services, based on classes of 2013-2017
This section provides information on graduate school, employment, and other outcome-related information for the class of 2021 using the Follow-Up Survey of the Center for Career Excellence, conducted 7-10 months post-graduation. For more information, select one of the tabs above or read the full report.
See below for more information on: