Senior Research Projects 2012 - 2013
Seniors present to the physics department the results of their Phys 489/490: SYE Advanced Laboratory and Phys 499: Honors SYE research projects at the end of each semester. The abstracts for their research are below and photos of the student presenters follow afterwards:
A Search for Variations in the Decay Rate of 54Mn During Solar Cycle 24 – Luke Dobrowski '13
(Fall 2012) Research by Jenkins and Fischbach (2009) indicates a 0.3% decrease in the decay rate of 54Mn coincident with an X3-class solar flare on 12/13/2006. To better understand any potential connections between solar activity and decay rate variation the decay rate of a 1-μCi sample of 54Mn was measured at St. Lawrence University during a portion of Solar Cycle 24. Approximately 1.29x10⁷ counts were collected in each 2-hour bin from November 8th – December 16th of 2012 with fractional uncertainties on the order of ~0.03%. The largest solar flare observed during this time period was an M6-class flare on 11/12/2012 and no variations away from the monotonic exponential decay were observed. These results are consistent with the limits of fractional uncertainty within the experiment.
(Spring 2013) Research by Jenkins and Fischbach (2009) indicates a 0.3% change in the decay rate of 54Mn coincident with an X3-class solar flare on 12/13/06. To better understand any potential connections between solar activity and decay rate variation the decay rate of a 1-μCi sample of 54Mn was measured at St. Lawrence University during a portion of Solar Cycle 24. Approximately 1.29x10⁷ counts were collected in each 2-hour bin from November 8th to December 16th of 2012 with fractional uncertainties on the order of ~0.03%. The largest solar flare observed during this time period was an M6-class flare on 11/12/12 and no deviation from the monotonic exponential decay was observed. These results are consistent with the limits of fractional uncertainty within the experiment. A second similar experiment measured approximately 2.11x10⁷ counts per 4-hour bin from February 10th to March 21st of 2013 thus reducing fractional uncertainty to ~0.023%. One deviation from the expected monotonic decay was observed coinciding with an M1.1 class solar flare on 03/15/13, while another deviation was observed with no correlation to major solar flare events. Mathematical analysis suggests that there is an alternative factor that could produce the same discrepancy; we are investigating this experimentally.
For more information, contact Dr. Karen Johnson
The Zwicky Cluster 1400+0949 – Steven Goldman '13
(Fall 2012) The galaxy cluster Zwicky 1400+0949, also known as MKW 12 and the NGC 5416 group, has been observed in radio as part of the Arecibo Legacy Fast ALFA HI Survey (ALFALFA), in visible light as part of the Sloan Digital Sky Survey (SDSS) and X‐ray as part of the Einstein and Röntgensatellit (ROSAT) mission. A flux and luminosity were calculated from the X‐ray data in the soft (0.1 – 0.9keV), the hard (0.4 – 2.4keV), and the broad (0.1 – 2.4keV) energy bands. Given the fact that typical loosely wound isolated galaxy(Scd) source has an X‐ray luminosity of 2.09×1041 ergs/s, our value of 2.34×1041 ergs/s for the broadband region can be considered an emission from an individual galaxy rather than an intracluster medium in the Zwicky cluster 1400+0949.
For more information, contact Dr. Aileen O'Donoghue
Pd/Mg Absorption of H2 – Roelof Groenewald '13
(Fall 2012) In this experiment we looked at how the charge transport properties (resistivity and Hall coefficient) of a 10 nm Pd layer changes when it absorbs and desorbs hydrogen gas. The absorption process is very complex and involves at least 3 different stages. We found that the time constant for the exponential curve of a temperature change was 38 s for the sample. Next we exposed the sample to a hydrogen atmosphere at 1 atm and found that the sheet resistance changes according to the sum of two exponential functions with time constants 38 s and 37 s where we believe the second function is actually the result of a temperature change. Possible causes for this behavior are discussed. Once these factors (except the hydrogen absorption) reach equilibrium the resistance of the sample decreases apparently linearly as more hydrogen is absorbed into the Pd. This only last for a couple of seconds before the resistance starts to increase according to an exponential function with a time constant of 413 s. We believe that this is due to desorption of hydrogen from the sample. The resistance then reaches equilibrium at a point that was on average 1.4% higher than it was before hydrogen was added. We also looked at how the Hall-signal is influenced by the absorption of hydrogen. We found that the Hall-signal decreases from -0.671±0.005 mV to -0.634±0.002 mV due to the hydrogen absorption/desorption cycles (decreased by 5.5%).
(Spring 2013) We studied the absorption and desorption cycle of hydrogen into magnesium by measuring how absorption is affected by changing the pressure of the hydrogen atmosphere surrounding our sample and how the desorption rate changes when we change the temperature of the sample. We used resistivity, Hall-signal and optical transmission measurements to monitor the amount of hydrogen absorbed in the sample (optical transmission measurements is useful since the magnesium sample becomes transparent as magnesium hydride forms). During absorption the sheet resistance of our samples increased by up to 48 times its original value and the voltage across the photodiode increased to about 3 times its original value. We found that the rate of absorption can be increased by starting the absorption process at a low pressure and then gradually increasing the pressure. An increase of more than 400% was seen in the average absorption rate using this technique. We also found that by increasing the temperature of the sample to about 100 °C during desorption the time constant of desorption decreased by 4 orders of magnitude. We calculated the diffusion coefficient for hydrogen flowing into magnesium by using the sheet resistance measurements to find the rate of magnesium hydride formation. The value of the diffusion coefficient was found to be 9x10-16 m2s-1.
For more information, contact Dr. Daniel Koon
Analyzing the Constrained Motion of a Falling Pencil – Torrey Hayden '13
(Fall 2012) Even though the pencil is a common object used by every physics student, the motion of a pencil falling is of particular interest because it is analogous to a well known forensics puzzle: how a body would rotate and fall from a height. Therefore, several scientists have investigated the theory of this constrained motion. We chose to measure the motion of the falling pencil itself to see how it compared with the theoretical motion. We collected video of the pencil falling using a high-speed camera and extracted several trials to the model qualitatively by graphing them together and quantitatively by finding that the standard deviation of the distribution of the residuals, δθ, to be Sθ = 0.0309 radians and Sθ = 0.0213 radians for two separate trials. Hence, we determined that the theory is consistent qualitatively, and for some trials quantitatively as well, with an actual pencil falling.
(Spring 2013) Even though the pencil is a common object used by every student, the motion of a pencil falling is of particular interest because it is analogous to a well known forensics puzzle: how a body would rotate and fall from a height. Therefore, several scientists have investigated the theory of this constrained motion. We chose to measure the motion of the falling pencil to see how it compared with the theoretical motion as developed by Rod Cross. We looked at two cases: one with the tip of the pencil in contact with the table and the other with the eraser. According to the theory the pencil would slip one way if the tip was down and the other if the eraser were down. We collected video of the pencil falling using a high-speed camera and extracted the details of the motion from the video. We graphed the data and theory together to find that for the angular progression the data and theory agreed and that theory agreed qualitatively with displacement of the tip. For the eraser we found that it slipped in the expected direction, but it did not slip as far as predicted.
For more information, contact Dr. Catherine Jahncke
Construction of a Micro-Raman Spectrometer – Alexander Knoll '13
(Fall 2012) Raman spectroscopy is a method of spectral analysis that relies on the inelastic scattering of photons off the surface of a sample in order to identify it and investigate particular characteristics. Micro-Raman spectroscopy relies on the same principles, but provides an increase in spatial resolution that allows for Raman analysis of smaller sample sizes, as well as effects that occur over smaller, more localized regions of a sample. A micro-Raman spectrometer apparatus was constructed by adding an Olympus BX-60 microscope to an existing macroscopic Raman spectrometer apparatus built by Jameson Cook and Dr. Catherine Jahncke in order to investigate the effects of stress on the Raman scattering of silicon. Due to inherent issues in the design of the apparatus, mostly due to the inclusion of a Raman-active fiber with a SiO2 core for transmitting scattered light, a Raman spectrum was not observed for silicon. Despite this, the Raman optics of the apparatus were confirmed to be working and Raman spectra were captured for naphthalene and diamond.
For more information, contact Dr. Catherine Jahncke
Booming Dunes – Emily Scannell '13
(Fall 2012) Booming sand is an uncommon natural phenomenon occurring when avalanching sands create a loud, sustained droning at a specific frequency. The conditions necessary for this were explored using a Mathematica simulation which numerically integrates the coupled differential equations for a 1-dimensional model of avalanching grains. Research is based on findings from R.A. Bagnold and his proposed model. Analysis of actual recordings of booming dunes indicated multiple frequencies, which were not evident in either Bagnold’s model or the Mathematica results. The results from Mathematicasimulations did not agree with Bagnold’s model.
For more information, contact Dr. Brian Watson
Determining Optimal Pitch Spacing For Measuring Hall Sheet Resistance With A Square Four Point Probe – Brian Thomas '13
(Fall 2012) In this experiment, I analyze how the spatial extent of a magnetic field affects the Hall signal measured by a square four point probe detector (S4PP). I tested 4PPs of pitch 5/16" to 1.5" and magnets of 0.5" to 1.0" diameter on a 5" diameter bismuth slab of thickness 0.05 cm. Using software to automatically collect Hall sheet resistance data, I find that if the pitch, the spacing between adjacent electrodes of a 4PP, is much smaller or much larger than the magnetic field radius, or far away from the field, no Hall sheet resistance will be measured. Furthermore, I find that if the electrodes straddle the edges of the magnetic field, an optimal Hall sheet resistance value will be measured, as predicted by recent research.
For more information, contact Dr. Daniel Koon
Building a 4-Bit Computer - Brian Thomas '13
(Spring 2013) In this experiment, I constructed a basic 4-bit central processing unit (CPU) out of logic gates and integrated circuits (IC). I also implemented edge-triggered registers out of D flip-flops. After confirming that the CPU worked as designed, I measured the delay between the input of the circuit, and the output of the circuit. I found that the output behaves like an RC circuit with a capacitance of 1.83 nanofarads and a resistance of 600 ohms. The measured delay between the input and output signals was measured to be 500 nanoseconds.
For more information, contact Dr. Catherine Jahncke
Senior Presenters

Senior Presenters
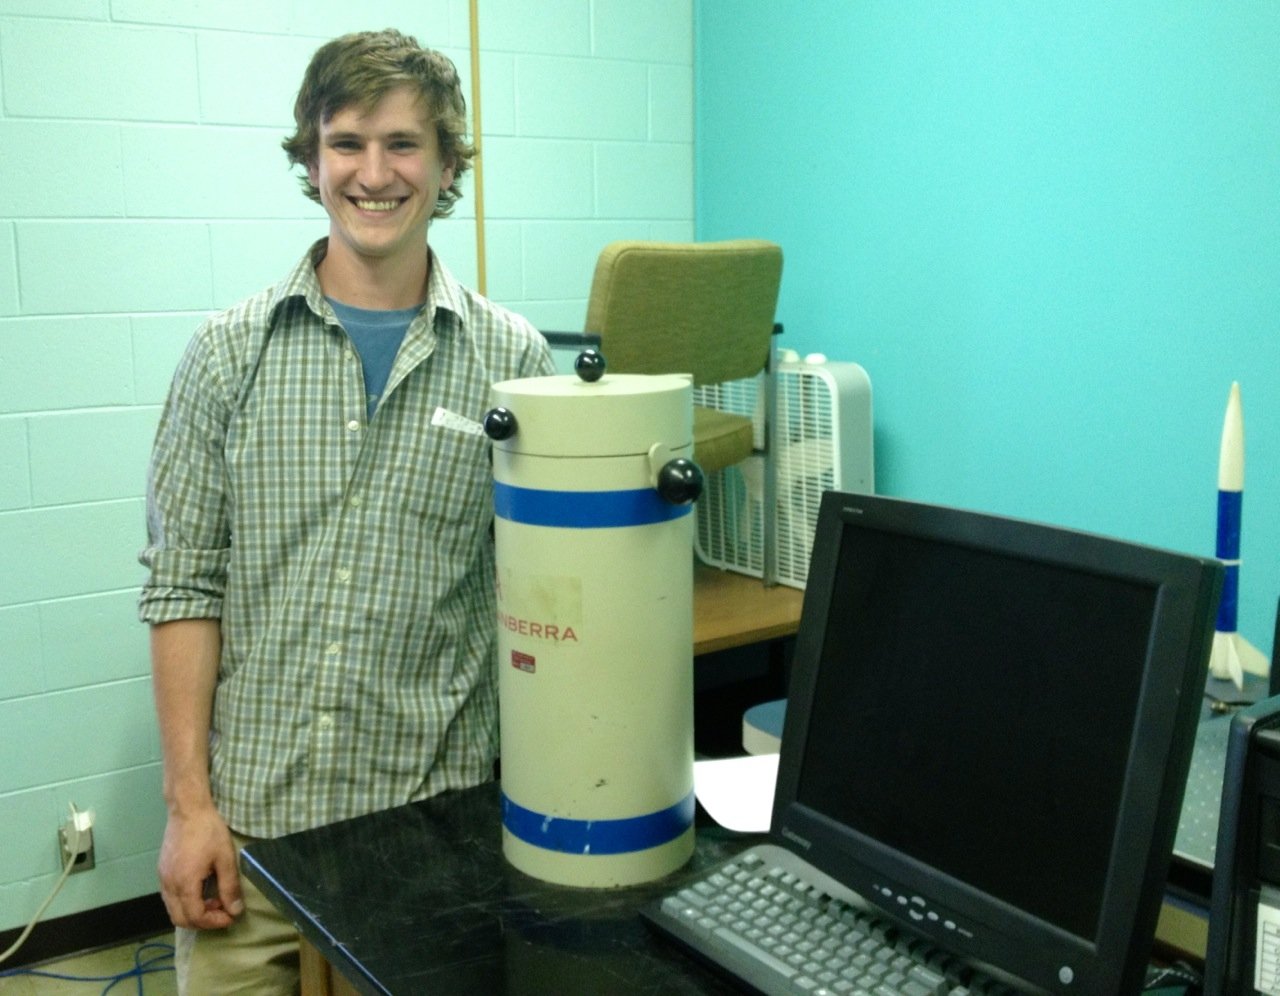
Luke Dobrowksi
A Search for Variations in the Decay Rate of 54Mn During Solar Cycle 24
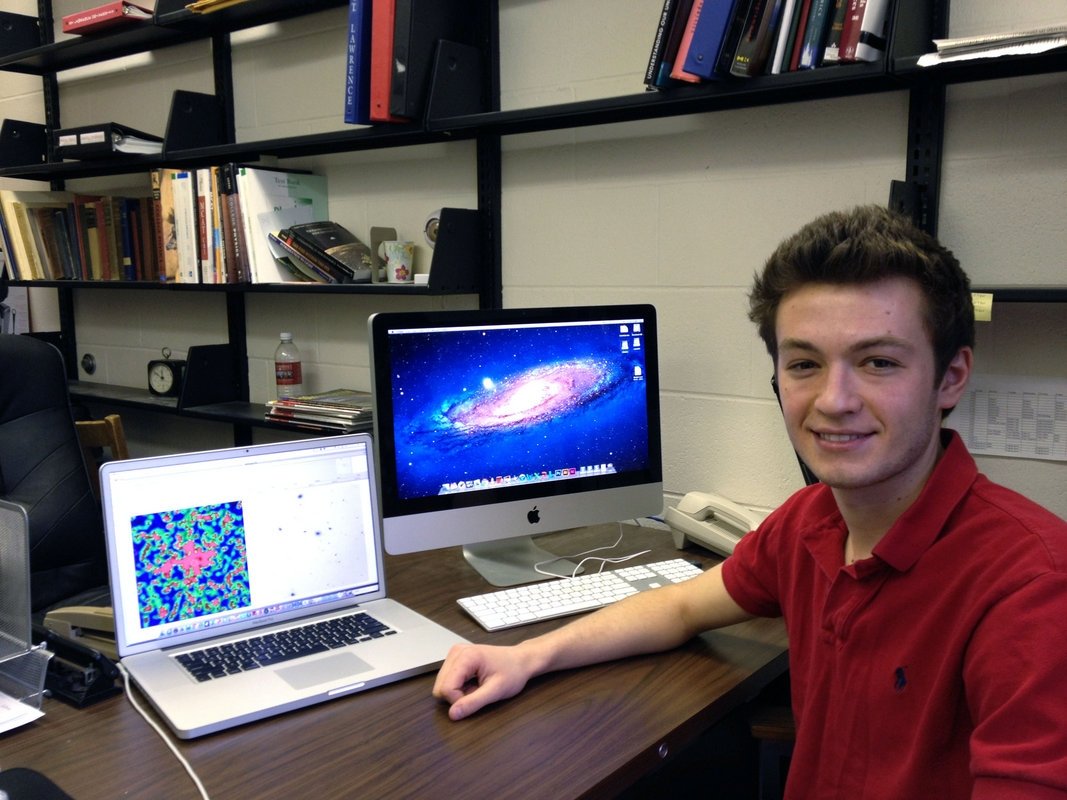
Steve Goldman
The Zwicky Cluster 1400+0949
Roelof Groenwald
Pd/Mg Absorption of H2
Torrey Hayden
Analyzing the Constrained Motion of a Falling Pencil
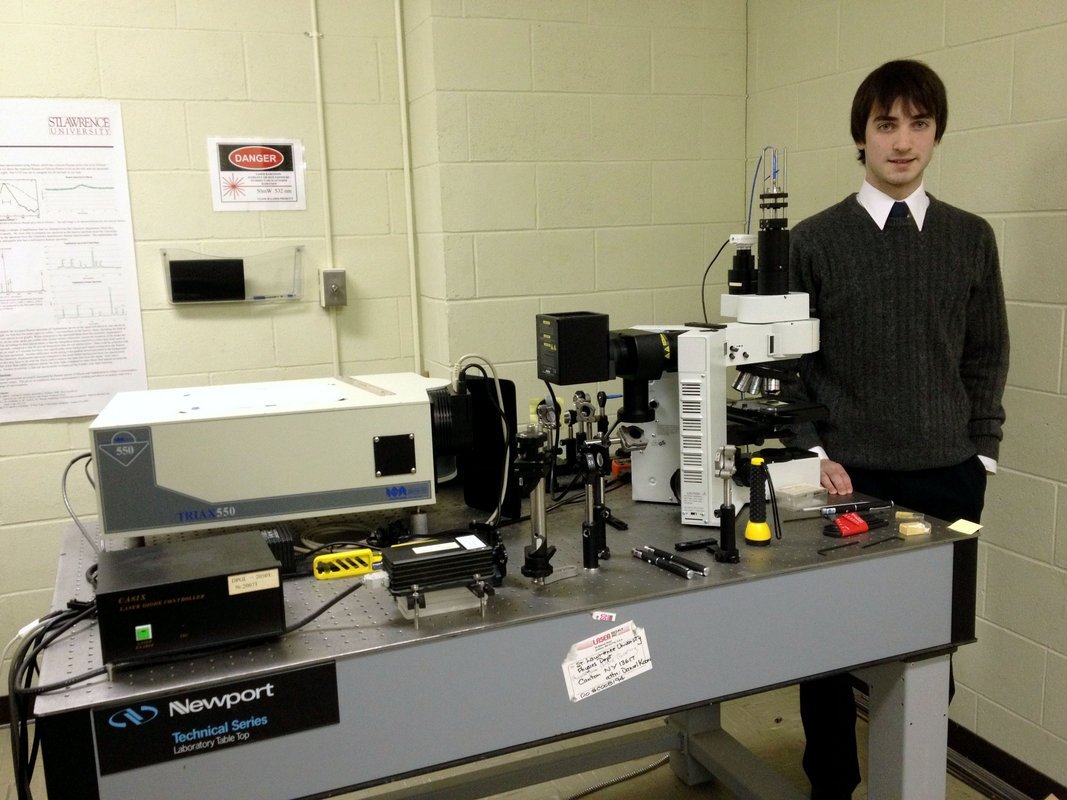
Alex Knoll
Construction of a Micro-Raman Spectrometer
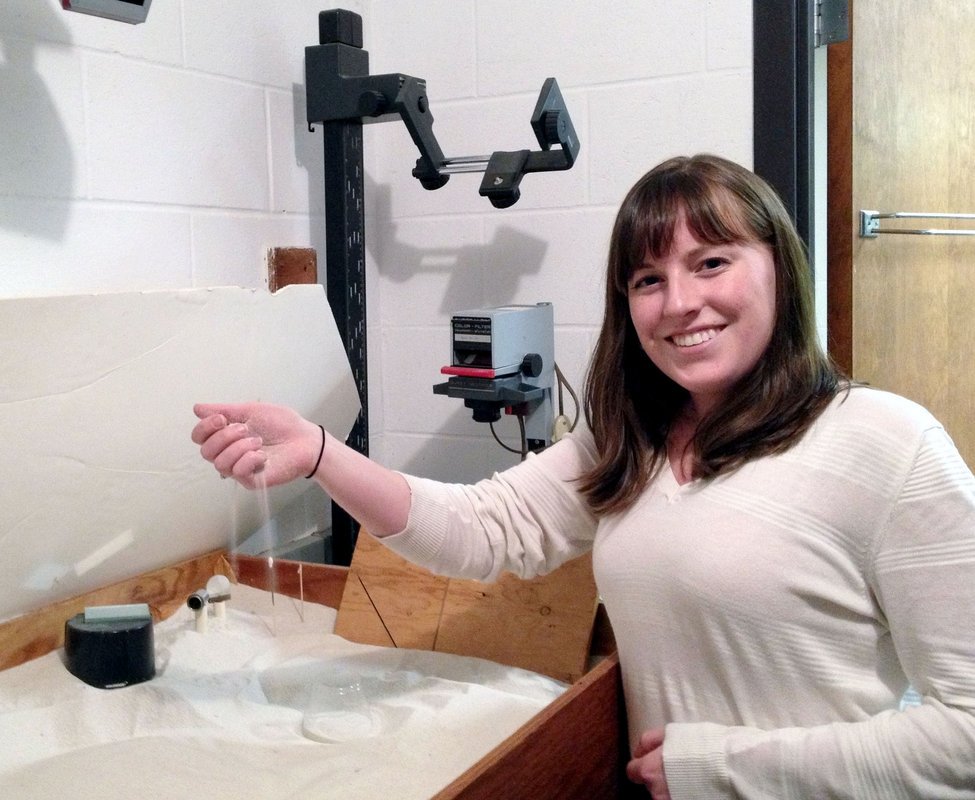
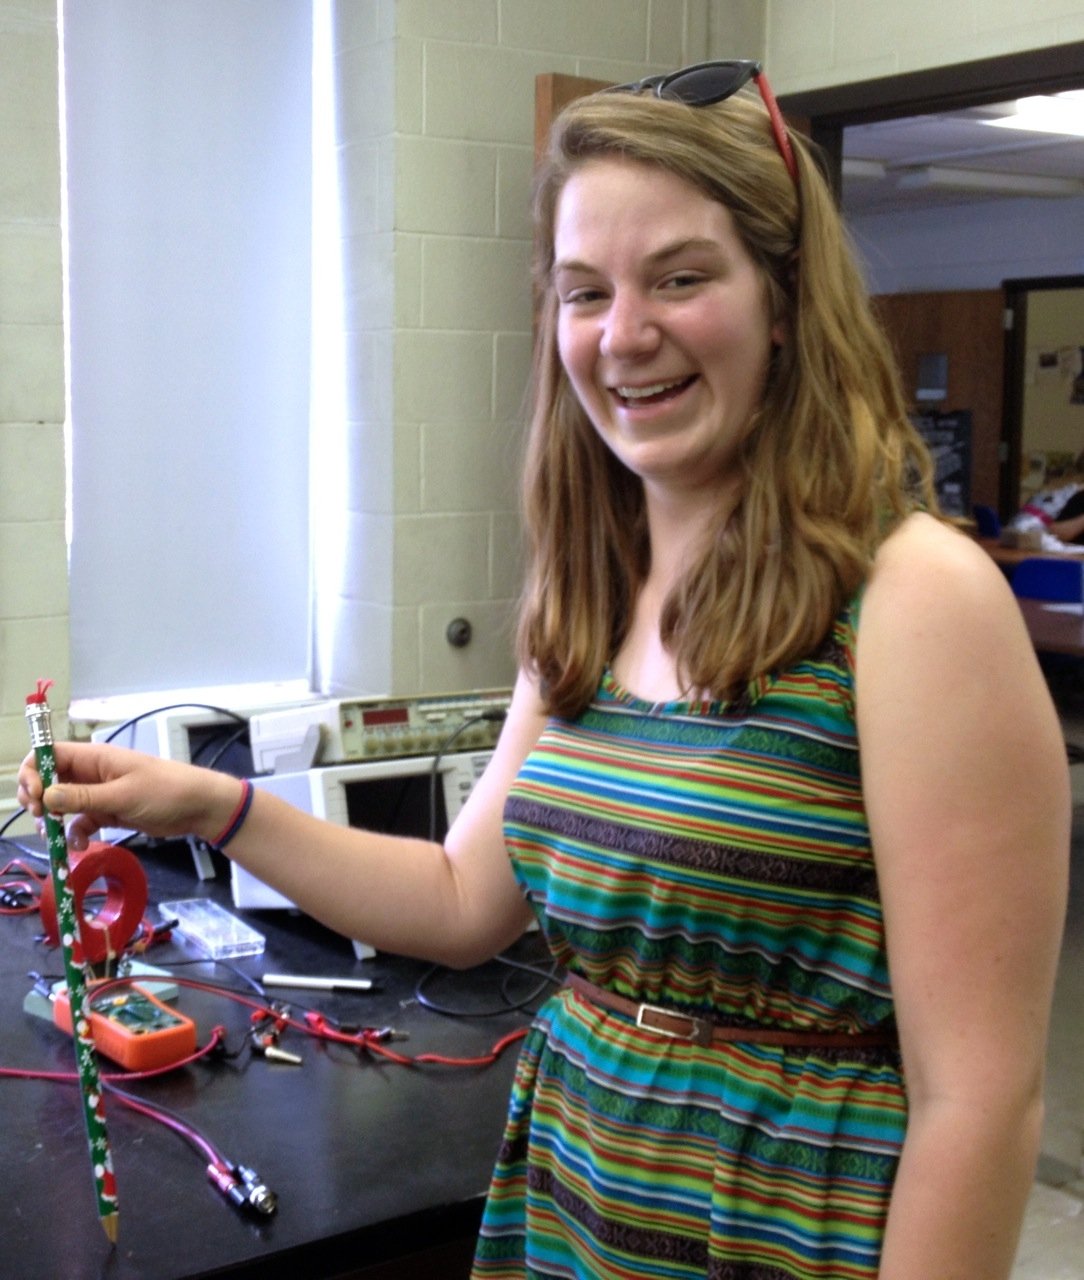
Emily Scannell
Booming Dunes
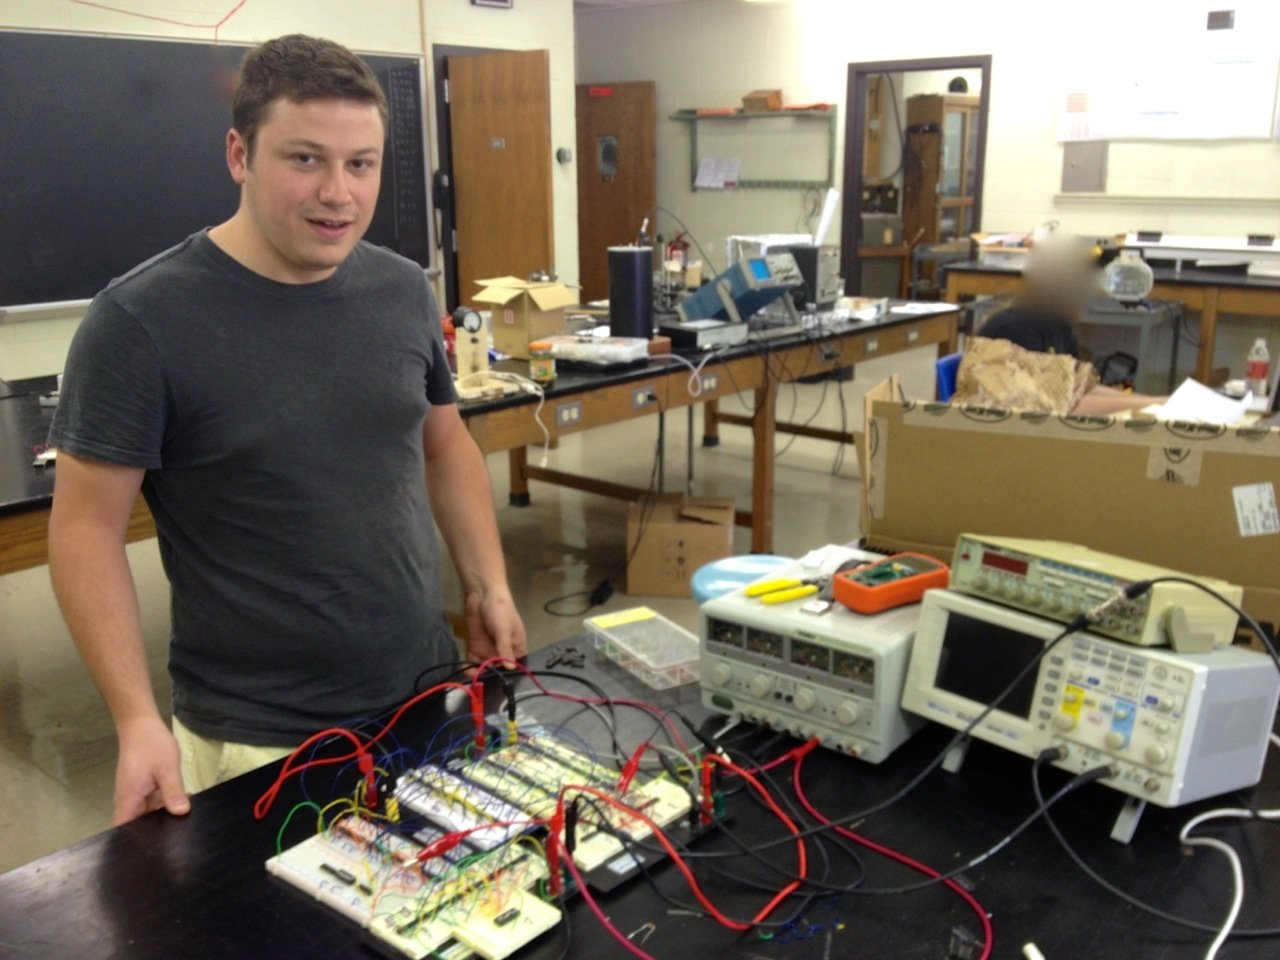
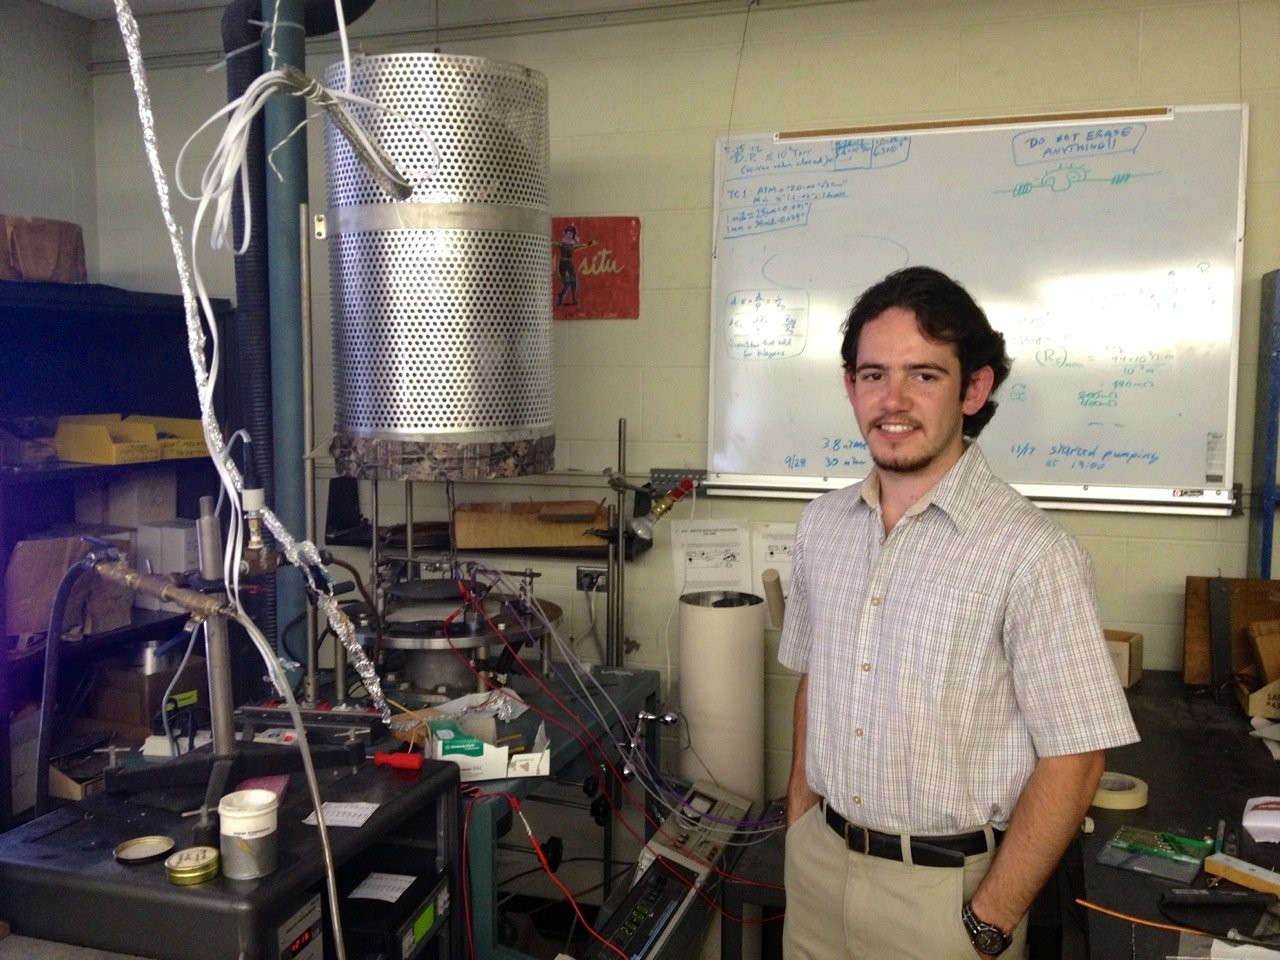
Brian Thomas
Determining Optimal Pitch Spacing For Measuring Hall Sheet Resistance With A Square Four Point Probe