Sports in the Time of COVID
Not spending time on the ‘what ifs’ and beginning each day with gratitude
Not spending time on the ‘what ifs’ and beginning each day with gratitude
NETVUE GRANT AWARD SUPPORTS "PURPOSE-DRIVEN EDUCATION" COURSE DEVELOPMENT AND PROGRAMS FOR FACULTY AND STUDENTS In spring 2024, SLU received a two-year program development grant award from the Network for Vocation...
NEW DEADLINE - September 15!
From the Career Services Follow-Up Survey, Class of 2020
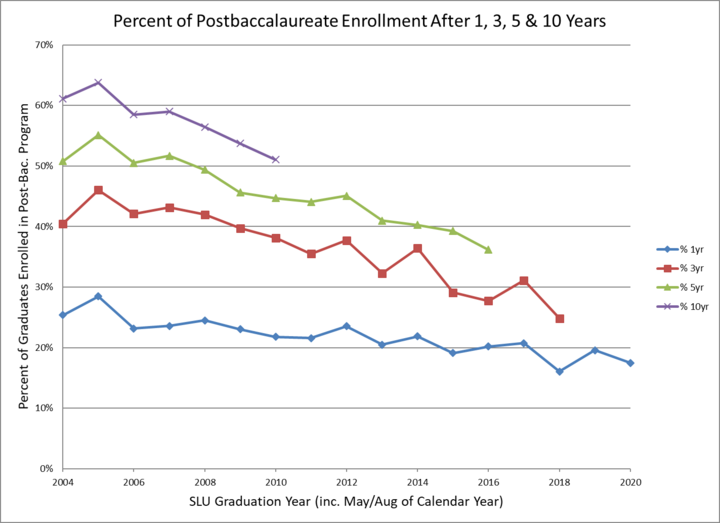
Classes of 2012-2016; From National Student Clearinghouse + Advancement office data
Classes of 2012-2016
Lists the first school a student enrolled at after graduating from St. Lawrence. Based on National Student Clearinghouse and Career Services data for class years of 2012-2016.
If a student attended more than one school after graduating from St. Lawrence, each school gets counted once. Based on National Student Clearinghouse data for class years of 2007-2011.
Percentage of students who majored in the arts, humanities, sciences, social sciences, or interdisciplinary areas of study for the classes of 2012-2016 that enrolled in a college/university or professional school within 5 years of graduating from St. Lawrence. Double major students with majors in different divisions are counted once for each division. Data are from the National Student Clearinghouse and Career Services Survey.
Outcomes Profiles covering a 5-year aggregate for each division/department are available.
Number of Class of 2020 graduates who continued education within 7-9 months after graduating from St. Lawrence. Data is from the Career Services Survey.
| Graduate Program Type | Number Attending | % Attending |
|---|---|---|
| Science & Technology | 20 | 29.9% |
| Social Sciences | 19 | 28.4% |
| Arts & Humanities | 7 | 10.4% |
| Medicine | 6 | 9.0% |
| Business | 4 | 6.0% |
| Nursing/PA/NP | 3 | 4.5% |
| Other Postbacc. Programs | 3 | 4.5% |
| Education | 2 | 3.0% |
| Law | 1 | 1.5% |
| Allied Health | 1 | 1.5% |
| Total Graduate School | 67 | 100.0% |
From the Career Services Follow-Up Survey, Class of 2019
Classes of 2011-2015; From National Student Clearinghouse + Advancement office data
Classes of 2011-2015
Lists the first school a student enrolled at after graduating from St. Lawrence. Based on National Student Clearinghouse and Career Services data for class years of 2011-2015.
If a student attended more than one school after graduating from St. Lawrence, each school gets counted once. Based on National Student Clearinghouse data for class years of 2006-2010.
Percentage of students who majored in the arts, humanities, sciences, social sciences, or interdisciplinary areas of study for the classes of 2011-2015 that enrolled in a college/university or professional school within 5 years of graduating from St. Lawrence. Double major students with majors in different divisions are counted once for each division. Data are from the National Student Clearinghouse and Career Services Survey.
Outcomes Profiles covering a 5-year aggregate for each division/department are available.
Number of Class of 2019 graduates who continued education within 7-9 months after graduating from St. Lawrence. Data is from the Career Services Survey.
| Graduate Program Type | Number Attending | % Attending |
|---|---|---|
| Science & Technology | 18 | 21.2% |
| Social Sciences | 17 | 20.0% |
| Education | 11 | 12.9% |
| Medicine | 8 | 9.4% |
| Business | 6 | 7.1% |
| Arts & Humanities | 6 | 7.1% |
| Other Postbacc. Programs | 6 | 7.1% |
| Allied Health | 5 | 5.9% |
| Law | 4 | 4.7% |
| Nursing/PA/NP | 4 | 4.7% |
| Total Graduate School | 85 | 100.0% |
From the Career Services Follow-Up Survey, Class of 2017
Classes of 2009-2013; From National Student Clearinghouse + Advancement office data
Classes of 2009-2013
Lists the first school a student enrolled at after graduating from St. Lawrence. Based on National Student Clearinghouse and Career Services data for class years of 2009-2013.
If a student attended more than one school after graduating from St. Lawrence, each school gets counted once. Based on National Student Clearinghouse data for class years of 2004-2008.
Percentage of students who majored in the arts, humanities, sciences, social sciences, or interdisciplinary areas of study for the classes of 2009-2013 that enrolled in a college/university or professional school within 5 years of graduating from St. Lawrence. Double major students with majors in different divisions are counted once for each division. Data are from the National Student Clearinghouse and Career Services Survey.
Outcomes Profiles covering a 5-year aggregate for each division/department are available.
Number of Class of 2017 graduates who continued education within 7-9 months after graduating from St. Lawrence. Data is from the Career Services Survey.
| Graduate Program Type | Number Attending | % Attending |
|---|---|---|
| Science & Technology | 16 | 18.0% |
| Social Sciences | 16 | 18.0% |
| Education | 15 | 16.9% |
| Medicine/Dentistry/Veterinary | 11 | 12.4% |
| Nursing/PA/NP | 7 | 7.9% |
| Law | 7 | 7.9% |
| Allied Health | 6 | 6.7% |
| Arts & Humanities | 4 | 4.5% |
| Business | 3 | 3.4% |
| Total Graduate School | 89 | 100.0% |
From the Career Services Follow-Up Survey, Class of 2016
Classes of 2007-2011; From National Student Clearinghouse + Advancement office data
Classes of 2007-2011
Lists the first school a student enrolled at after graduating from St. Lawrence. Based on National Student Clearinghouse and Career Services data for class years of 2007-2011.
If a student attended more than one school after graduating from St. Lawrence, each school gets counted once. Based on National Student Clearinghouse data for class years of 2002-2006.
Percentage of students who majored in the arts, humanities, sciences, social sciences, or interdisciplinary areas of study for the classes of 2007-2011 that enrolled in a college/university or professional school within 5 years of graduating from St. Lawrence. Double major students with majors in different divisions are counted once for each division. Data are from the National Student Clearinghouse and Career Services Survey.
Outcomes Profiles covering a 5-year aggregate for each division/department are available.
Number of Class of 2016 graduates who attended graduate school within 7-9 months after graduating from St. Lawrence. Data is from the Career Services Survey.
| Graduate Program Type | Number Attending | % Attending |
|---|---|---|
| Science & Technology | 24 | 27.0% |
| Education | 18 | 20.2% |
| Health-Related | 13 | 14.6% |
| Medicine/Dentistry/Pharmacy/Veterinary | 12 | 13.5% |
| Social Sciences | 8 | 9.0% |
| Arts & Humanities | 6 | 6.7% |
| Business | 5 | 5.6% |
| Law | 1 | 1.1% |
| Other Graduate Programs | 2 | 2.2% |
| Total Graduate School | 89 | 100.0% |
From the Career Services Follow-Up Survey, Class of 2014
Classes of 2007-2011; From National Student Clearinghouse + Advancement office data
Classes of 2007-2011
Lists the first school a student enrolled at after graduating from St. Lawrence. Based on National Student Clearinghouse and Career Services data for class years of 2007-2011.
If a student attended more than one school after graduating from St. Lawrence, each school gets counted once. Based on National Student Clearinghouse data for class years of 2002-2006.
Percentage of students who majored in the arts, humanities, sciences, social sciences, or interdisciplinary areas of study for the classes of 2007-2011 that enrolled in a college/university or professional school within 5 years of graduating from St. Lawrence. Double major students with majors in different divisions are counted once for each division. Data are from the National Student Clearinghouse and Career Services Survey.
Outcomes Profiles covering a 5-year aggregate for each division/department are available.
Number of Class of 2015 graduates who attended graduate school within 7-9 months after graduating from St. Lawrence. Data is from the Career Services Survey.
| Graduate Program Type | Number Attending | % Attending |
|---|---|---|
| Education | 20 | 23.5% |
| Science & Technology | 13 | 15.3% |
| Health-Related | 12 | 14.1% |
| Medicine/Dentistry/Pharmacy/Veterinary | 10 | 11.8% |
| Law | 8 | 9.4% |
| Social Sciences | 8 | 9.4% |
| Business | 5 | 5.9% |
| Other Graduate Programs | 5 | 5.9% |
| Arts & Humanities | 4 | 4.7% |
| Not Indicated | 0 | 0.0% |
| Total Graduate School | 85 | 100.0% |
From the Career Services Follow-Up Survey, Class of 2014
Classes of 2006-2010; From National Student Clearinghouse + Advancement office data
Classes of 2006-2010
Lists the first school a student enrolled at after graduating from St. Lawrence. Based on National Student Clearinghouse and Career Services data for class years of 2006-2010.
If a student attended more than one school after graduating from St. Lawrence, each school gets counted once. Based on National Student Clearinghouse data for class years of 2001-2005.
Percentage of students who majored in the arts, humanities, sciences, social sciences, or interdisciplinary areas of study for the classes of 2006-2010. These students enrolled in a college/university or professional school within 5 years of graduating from St. Lawrence. Double major students with majors in different divisions are counted once for each division. Data are from the National Student Clearinghouse and Career Services Survey.
Outcomes Profiles covering a 5-year aggregate for each division/department are available.
Number of Class of 2014 graduates who attended graduate school within 7-9 months after graduating from St. Lawrence. Data is from the Career Services Survey.
| Graduate Program Type | Number Attending | % Attending |
|---|---|---|
| Science & Technology | 24 | 27.3% |
| Health-Related | 19 | 21.6% |
| Medicine | 12 | 13.6% |
| Education | 11 | 12.5% |
| Business | 7 | 8.0% |
| Social Sciences | 5 | 5.7% |
| Law | 4 | 4.5% |
| Arts & Humanities | 4 | 4.5% |
| Other Graduate Programs | 2 | 2.3% |
| Not Indicated | 0 | 0.0% |
| Total Graduate School | 88 | 100.0% |
What better way to start your SLU experience than exploring your new backyard, meeting new friends, and breathing in fresh Adirondack air? The St. Lawrence Outdoor Program offers incoming first...