For Summer Research Fellowships at St. Lawrence, check out: The Summer Fellows Program or the Tanner Fellowship Program Many off-campus, Summer Undergraduate Research opportunities can be found directly on the...
The Power of the Liberal Arts About one in five St. Lawrence students enroll in postgraduate programs immediately after graduation, and our pre-professional and dual degree programs are among their...
Dr. Matthew Carotenuto, Associate Dean for International and Intercultural Studies and Professor of History Dr. Diane Husic , Richard ’64 and Gail Stradling Executive Director of the Center for the...
Collected here are links to photographic and image galleries of some of the many events, student course work, or happenings by the Art and Art History department. See below for...
The Senior Executive Board of the Thelomathesian Society leads the organization and includes the President, the Vice President of Senate Affairs, the Vice President of University Relations, the Student Delegate...
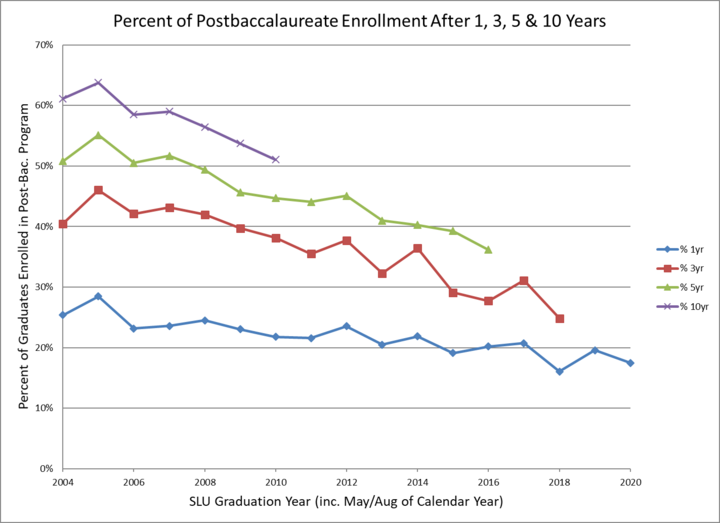
Class of 2011 enrolled in further study 7-10 months out
From the Career Services Follow-Up Survey, Class of 2011
50%
Attend grad school within 5 years
From National Student Clearinghouse + Advancement office data
25%
Earn a graduate degree within 5 years
Top Graduate Schools Enrolled At Within 5 years
Based on National Student Clearinghouse and Career Services data for class years from 2000-2007 for any enrollment within 5 years of graduation.
St. Lawrence University
SUNY Potsdam
Syracuse University
SUNY Albany
University at Buffalo
Harvard University
University of Vermont
Clarkson University
University of Southern Maine
Boston University
Top Graduate Schools Enrolled At Within 10 years
Based on National Student Clearinghouse and Career Services data for class years from 2000-2002 for any enrollment within 10 years of graduation.
St. Lawrence University
SUNY Potsdam
Harvard University
SUNY Albany
Syracuse University
University of Southern Maine
SUNY Buffalo
Lesley University
SUNY Plattsburgh
The College of Saint Rose
University of Vermont
By Division
This table lists percentages of students who majored in the sciences, social sciences, humanities, and area/interdisciplinary studies in the classes of 2000-2007 who enroll in graduate or professional school within 3 and 5 years after graduating. Students with double majors in different divisions are counted once for each unique division they majored in. Data are from the National Student Clearinghouse.
Division
After 3 Years
After 5 years
Sciences
54%
60%
Social Sciences
35%
41%
Humanities
38%
47%
Area/Interdisciplinary
31%
43%
Graduate/Professional School Programs
Below is a breakdown of the number of students who attended graduate school within 6 months of graduating from St. Lawrence.
Graduate Program Type
Number Attending
% of Attending
Education
23
29.1%
Business
10
12.7%
Social Sciences
9
11.4%
Law
8
10.1%
Medicine/Dentistry/Pharmacy/Veterinary
7
8.9%
Health-Relate4d
5
6.3%
Arts & Humanities
5
6.3%
Science & Technology
5
6.3%
Other Graduate Programs
4
5.1%
Not Indicated
3
3.8%
Total Graduate/Professional School
79
100%
*Graduate and Professional School only, does not include other post baccalaureate education. Data courtesy of Career ServicesNew:Outcomes Profiles covering a 5-year aggregate for each academic division are now available.
Welcome! As you begin planning your first year of study at St. Lawrence, you may have questions about how to structure your academic plan in a way to suit your...
Students can combine a liberal arts education with an engineering degree through St. Lawrence's combined engineering program with four engineering schools (see Participating Universities). The most popular option is the...
2020 Festival of Science, Scholarship & Creativity Schedule Friday, April 24, 2020 8:45 am - 8:55 am: Opening Remarks, Karl Schonberg, Vice President of the University and Dean of Academic...