Graduate Diversity
Undergraduate Degree Recipients (Year includes May, previous December, and previous August)
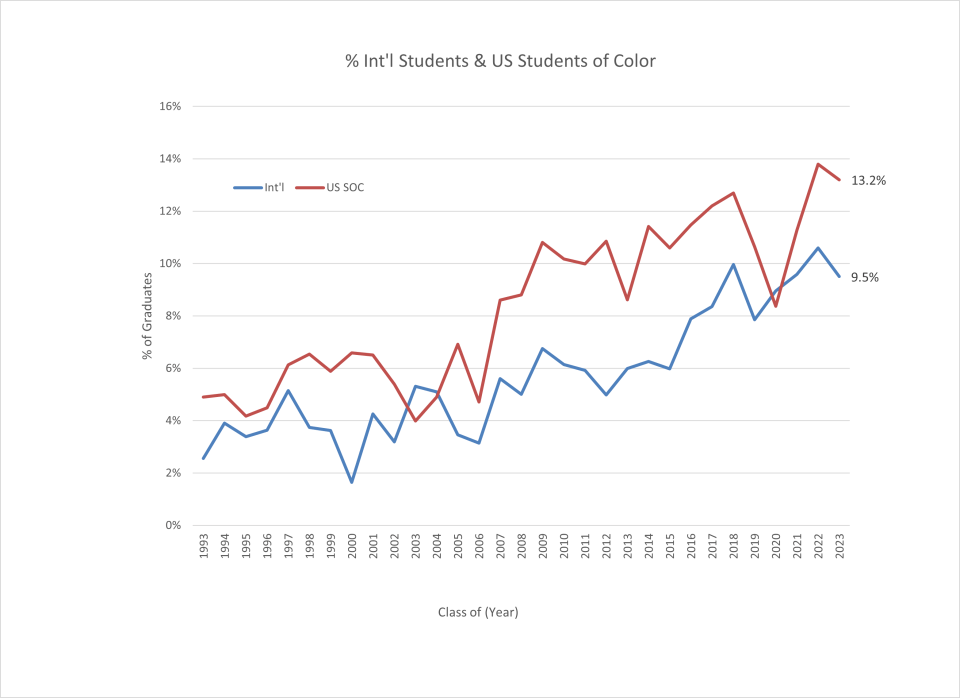
| Year | Amer. Indian / Alaskan Native | Asian | Black | Hispanic | Hawaiian / Pacific Isl. | Multi-Racial | White | Unknown | Non-Resident Aliens | Grand Total | % US Students of Color | % International |
|---|---|---|---|---|---|---|---|---|---|---|---|---|
| 2010 | 3 | 12 | 22 | 8 | 0 | 8 | 419 | 17 | 32 | 521 | 10.2% | 6.1% |
| 2011 | 0 | 11 | 13 | 22 | 1 | 7 | 443 | 12 | 32 | 541 | 10.0% | 5.9% |
| 2012 | 4 | 9 | 14 | 21 | 2 | 11 | 468 | 5 | 28 | 562 | 10.9% | 5.0% |
| 2013 | 0 | 1 | 18 | 20 | 0 | 7 | 439 | 17 | 32 | 534 | 8.6% | 6.0% |
| 2014 | 3 | 11 | 20 | 17 | 1 | 10 | 444 | 3 | 34 | 543 | 11.4% | 6.3% |
| 2015 | 0 | 7 | 15 | 20 | 0 | 20 | 484 | 4 | 35 | 585 | 10.6% | 6.0% |
| 2016 | 2 | 15 | 11 | 26 | 1 | 9 | 446 | 4 | 44 | 558 | 11.5% | 7.9% |
| 2017 | 1 | 8 | 27 | 23 | 1 | 10 | 453 | 3 | 48 | 574 | 12.2% | 8.4% |
| 2018 | 0 | 12 | 16 | 23 | 0 | 14 | 395 | 1 | 51 | 512 | 12.7% | 10.0% |
| 2019 | 1 | 8 | 13 | 24 | 0 | 15 | 466 | 1 | 45 | 573 | 10.6% | 7.9% |
| 2020 | 0 | 6 | 12 | 18 | 0 | 7 | 420 | 5 | 46 | 514 | 8.4% | 8.9% |
| 2021 | 1 | 4 | 14 | 28 | 0 | 13 | 417 | 5 | 50 | 532 | 11.3% | 9.4% |
| 2022 | 0 | 11 | 22 | 29 | 0 | 11 | 397 | 3 | 56 | 529 | 13.8% | 10.6% |
| 2023 | 1 | 15 | 21 | 24 | 0 | 10 | 415 | 1 | 51 | 538 | 13.2% | 9.5% |